本文档面向已经了解 面板小程序开发 的开发者,您需要充分的了解什么是面板小程序,并需要了解 Render Script 的使用。
相关知识
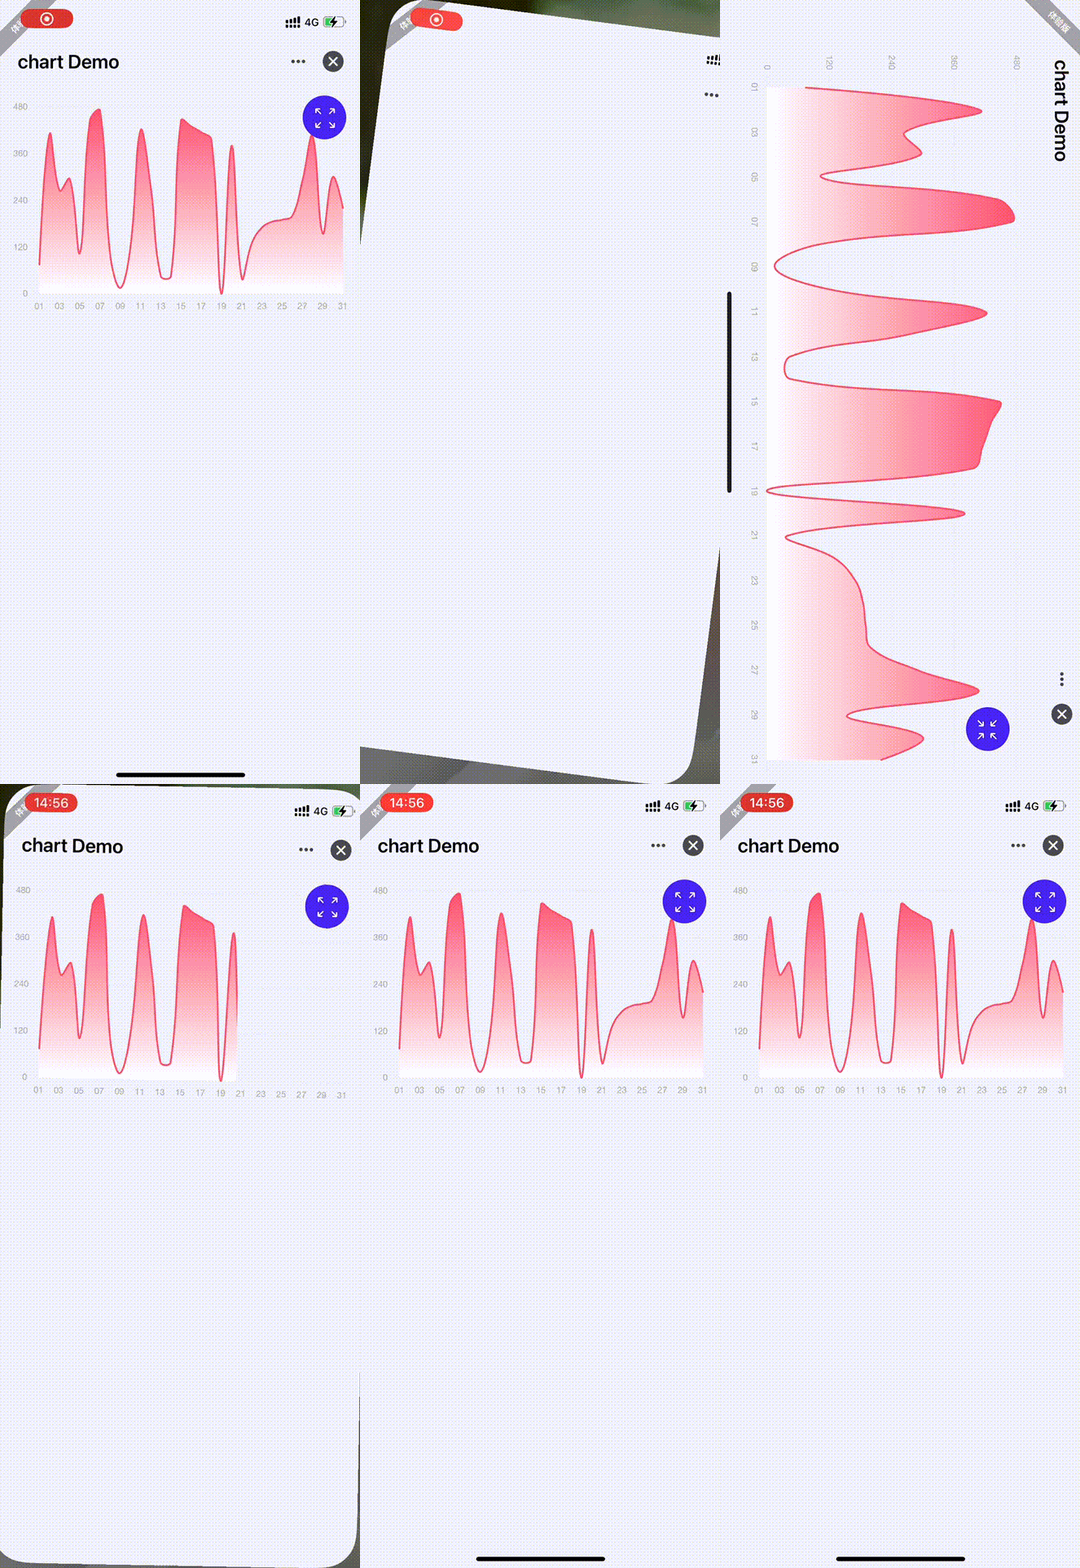
在小程序开发时,通常会有一些业务是需要提供图表展示数据的功能,以便为用户提供分析的能力。但由于用户一般使用竖屏浏览,此时图表的展示就不够直观,对用户的使用带来不好的体验。因此通常可以再提供图表横屏展示的功能,这样就可以更好的运用屏幕的显示范围更好的展示图表数据,本文将主要介绍如何实现图表且可支持横屏展示图表的开发方案。
在智能小程序需要使用 canvas 来进行图表的绘制,这里我们使用 AntV F2 来进行图表绘制。在小程序中对于 canvas 的处理,我们使用 Render Script 进行,所以这里需要使用原生组件进行处理图表组件。
使用的技术
示例代码
index.tyml
<canvas class="chart-canvas" style="{{style}};opacity:{{loading?0:1}};" canvas-id="chartCanvas" />
index.js
import Render from "./index.rjs";

Component({
	/**
	 * 组件的属性列表
	 */
	properties: {
		data: { type: Array },
		style: { type: null },
	},

	/**
	 * 组件的初始数据
	 */
	data: {
		loading: true,
	},
	observers: {
		data: function (data) {
			if (this.render) {
				const systemInfo = ty.getSystemInfoSync();
				this.render.drawChart(systemInfo, data);
			}
		},
	},
	pageLifetimes: {
		resize() {
			this.setData({ loading: true });
			// 获取画布的大小
			ty.createSelectorQuery()
				.select("#chartCanvas")
				.boundingClientRect()
				.exec((res) => {
					this.initChart(res[0]);
				});
			setTimeout(() => {}, 50);
		},
	},
	/**
	 * 组件的方法列表
	 */
	methods: {
		async initChart(rect) {
			const systemInfo = ty.getSystemInfoSync();
			await this.render.initChart(systemInfo, rect, "auto");
			this.render.drawChart(systemInfo, this.data.data);
			this.setData({ loading: false });
		},
	},

	lifetimes: {
		ready() {
			this.render = new Render(this);
			if (this.data.data) {
				const systemInfo = ty.getSystemInfoSync();
				this.render.drawChart(systemInfo, this.data.data);
				this.setData({ loading: false });
			}
		},
	},
});
index.less
// 默认 canvas的尺寸大小跟随父节点尺寸大小
.chart-canvas {
	width: 100%;
	height: 100%;
}
index.rjs
import F2 from "@antv/f2";
import { windowAdapter, documentAdapter } from "@tuya-miniapp/rjs-adapter";

// 这里处理 F2 的 polyfill
const noop = () => {};
const EMPTY_OBJ = {};
function createDocument() {
	const doc = {
		createElement: () => ({
			style: {},
		}),
		getElementById: () => {},
	};
	return Object.assign(EMPTY_OBJ, doc);
}
const document = createDocument();
const navigator = {
	userAgent: "",
};
const window = {
	document,
	navigator,
	addEventListener: noop,
	removeEventListener: noop,
};
windowAdapter(() => window);
documentAdapter(() => document);

let chart = null;

export default Render({
	// 初始化图表
	async initChart(systemInfo, rect, padding) {
		if (chart) {
			chart.destroy();
		}
		const { pixelRatio } = systemInfo;
		const canvas = await getCanvasById("chartCanvas");
		chart = new F2.Chart({
			el: canvas,
			pixelRatio,
			width: rect ? rect.width : canvas.width,
			height: rect ? rect.height : canvas.height,
			padding,
		});
	},
	// 绘制图表
	async drawChart(systemInfo, data) {
		if (!chart) {
			await this.initChart(systemInfo);
		}
		chart.clear();
		chart.source(data);
		chart.axis("time", {
			line: null,
			label(txt, index, total) {
				const color = index % 2 === 1 ? "transparent" : "rgba(0, 0, 0, 0.3)";
				return {
					text: txt,
					fontSize: 10,
					lineHeight: 14,
					fill: color,
				};
			},
		});

		chart.axis("value", {
			label(txt, index, total) {
				return {
					text: txt,
					fontSize: 10,
					lineHeight: 14,
					fill: "rgba(0, 0, 0, 0.3)",
				};
			},
		});

		chart.legend(false);

		chart
			.area({
				connectNulls: false,
			})
			.position("time*value")
			.shape("smooth")
			.color("code", (code) => `l(90) 0:#FD546E 1:#FFFFFF`)
			.style({
				fillOpacity: 1,
			});

		chart
			.line({
				connectNulls: false,
			})
			.position("time*value")
			.shape("smooth")
			.color("code", (code) => "#FD546E")
			.style({
				lineWidth: 2,
			});

		chart.render();
	},
});
页面使用 Ray 实现,在页面实现全屏效果。 这里将使用 setPageOrientation api 进行横竖屏切换,当切到横屏时,则为图表的全屏展示;当切到竖屏时,则图表普通展示,默认为普通展示。
注意: 在全屏时需要处理手机端安全区域的问题
import React, { FC, useCallback, useState } from "react";
import { View, setPageOrientation } from "@ray-js/ray";
import { Svg } from "@ray-js/svg";
import Chart from "./chart-base";
import styles from "./index.module.less";

const fullScreenIcon =
	"M285.866667 810.666667H384v42.666666H213.333333v-170.666666h42.666667v98.133333l128-128 29.866667 29.866667-128 128z m494.933333 0l-128-128 29.866667-29.866667 128 128V682.666667h42.666666v170.666666h-170.666666v-42.666666h98.133333zM285.866667 256l128 128-29.866667 29.866667-128-128V384H213.333333V213.333333h170.666667v42.666667H285.866667z m494.933333 0H682.666667V213.333333h170.666666v170.666667h-42.666666V285.866667l-128 128-29.866667-29.866667 128-128z";
const cancelFullScreenIcon =
	"M354.133333 682.666667H256v-42.666667h170.666667v170.666667H384v-98.133334L243.2 853.333333l-29.866667-29.866666L354.133333 682.666667z m358.4 0l140.8 140.8-29.866666 29.866666-140.8-140.8V810.666667h-42.666667v-170.666667h170.666667v42.666667h-98.133334zM354.133333 384L213.333333 243.2l29.866667-29.866667L384 354.133333V256h42.666667v170.666667H256V384h98.133333z m358.4 0H810.666667v42.666667h-170.666667V256h42.666667v98.133333L823.466667 213.333333l29.866666 29.866667L712.533333 384z";

const Page: FC = () => {
	// 当前屏的方向
	const [orientation, setOrientation] = useState(
		"portrait" as "landscape" | "portrait"
	);
	const [dataList] = useState(() => {
		// 模拟数据
		const res = [];
		for (let i = 0; i < 31; i++) {
			res.push({
				time: `202308${i.toString(10).padStart(2, "0")}`,
				value: 5 * Math.floor(100 * Math.random()),
			});
		}
		return res;
	});

	// 切换屏方向
	const triggerScreen = useCallback(() => {
		const newValue = orientation === "portrait" ? "landscape" : "portrait";
		setPageOrientation({
			pageOrientation: newValue,
			success: () => {
				setOrientation(newValue);
			},
			fail: () => {
				console.warn("切换失败");
			},
		});
	}, [orientation]);

	return (
		<View className={styles.page}>
			<View className={styles.btn} onClick={triggerScreen}>
				<Svg viewBox="0 0 1024 1024" width="36px" height="36px">
					<path
						d={
							orientation === "portrait" ? fullScreenIcon : cancelFullScreenIcon
						}
						fill="#fff"
					/>
				</Svg>
			</View>
			<View
				className={`${
					orientation === "landscape" ? styles.chartLandscape : styles.chart
				}`}
			>
				<Chart data={dataList} />
			</View>
		</View>
	);
};

export default Page;
index.module.less
// 页面样式
.page {
	height: 100vh;
	display: flex;
	flex-direction: column;
	align-items: stretch;
}
// 切换全屏按钮
.btn {
	position: absolute;
	top: 32rpx;
	right: 32rpx;
	width: 50px;
	height: 50px;
	border-radius: 50%;
	background: #4422ee;
	display: flex;
	justify-content: center;
	align-items: center;
	z-index: 1;
	color: #fff;
}
// 普通图表样式
.chart {
	height: 500rpx;
}
// 全屏图表样式
.chartLandscape {
	flex: 1;
	padding-bottom: env(safe-area-inset-bottom, 0px);
	padding-bottom: constant(safe-area-inset-bottom, 0px);
	padding-left: env(safe-area-inset-left, 0px);
	padding-left: constant(safe-area-inset-left, 0px);
	padding-top: env(safe-area-inset-top, 0px);
	padding-top: constant(safe-area-inset-top, 0px);
	padding-right: env(safe-area-inset-right, 0px);
	padding-right: constant(safe-area-inset-right, 0px);
}
