Module Debugging Assistant
The Module Debugging Assistant is a serial port debugger integrated with the serial communication protocols for Tuya network modules. It can simulate both the network module and MCU to help verify your MCU SDK development. The support for a bunch of protocols such as Wi-Fi, Wi-Fi and Bluetooth combo, Bluetooth, Zigbee, NB-IoT, and LTE Cat.1 enables you to perform a comprehensive test on your embedded system.
This topic describes how to use the Module Debugging Assistant, using the Wi-Fi protocol as an example. The instructions also apply to other network modules, with slight differences in specific features.
System requirements
-
The Module Debugging Assistant is built on top of Windows Presentation Foundation (WPF).
-
Install .NET Framework 4.6.1 depending on your OS.
- Install .NET Framework 4.6.1 on Windows 7 or later, or earlier than Windows 10 version 1511.
- .NET Framework is not required for Windows 10 version 1511 or later.
Windows XP and macOS are not supported.
Download
Method one
Download production solution tool to adapt to the latest protocol.
Method two
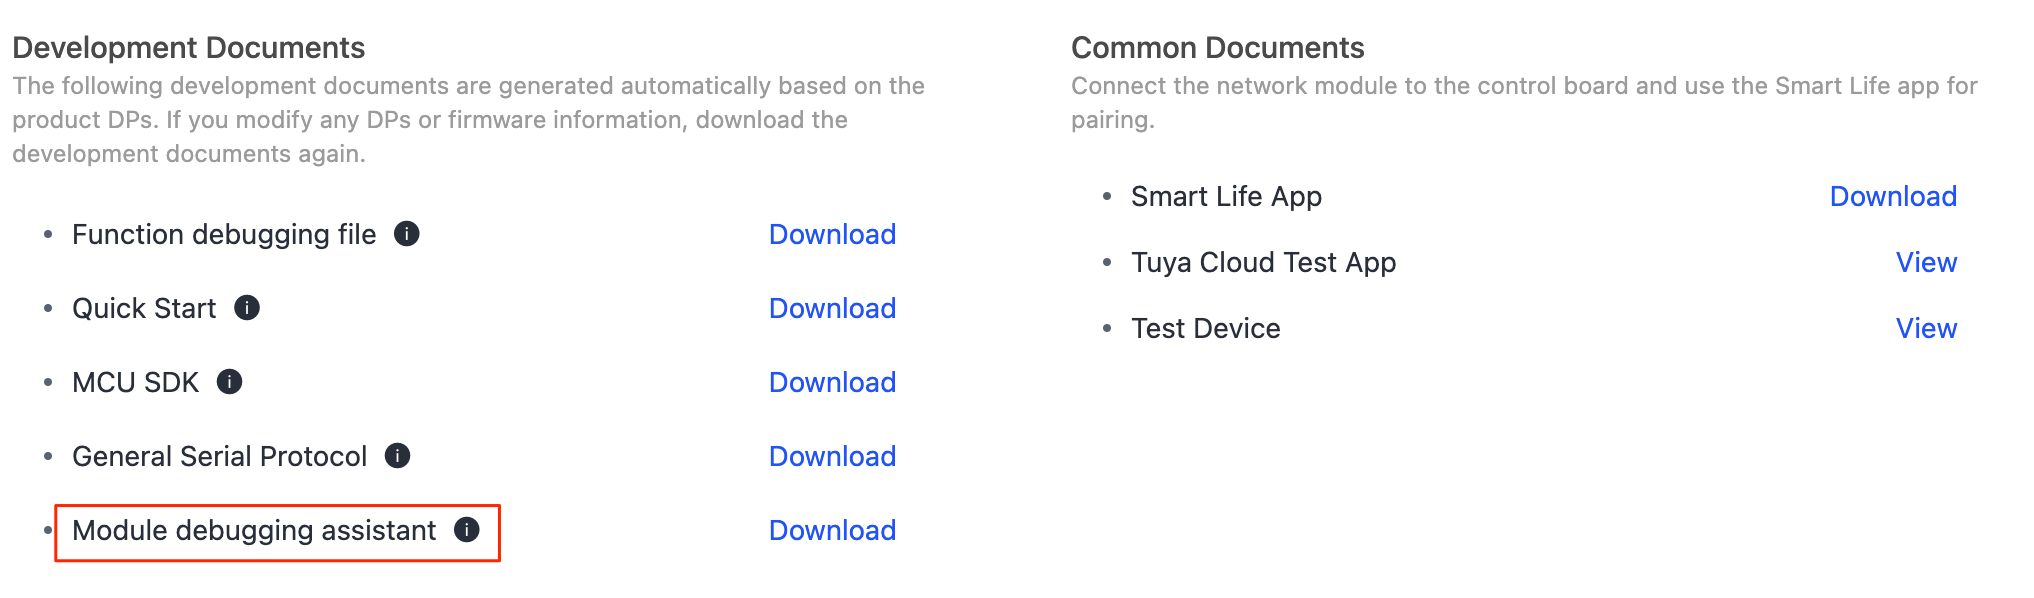
Create a product using the Custom Solution on the Tuya Developer Platform. In Hardware Development, scroll down to Download Documents and download the Module Debugging Assistant. For more information about product creation, see Create Products.
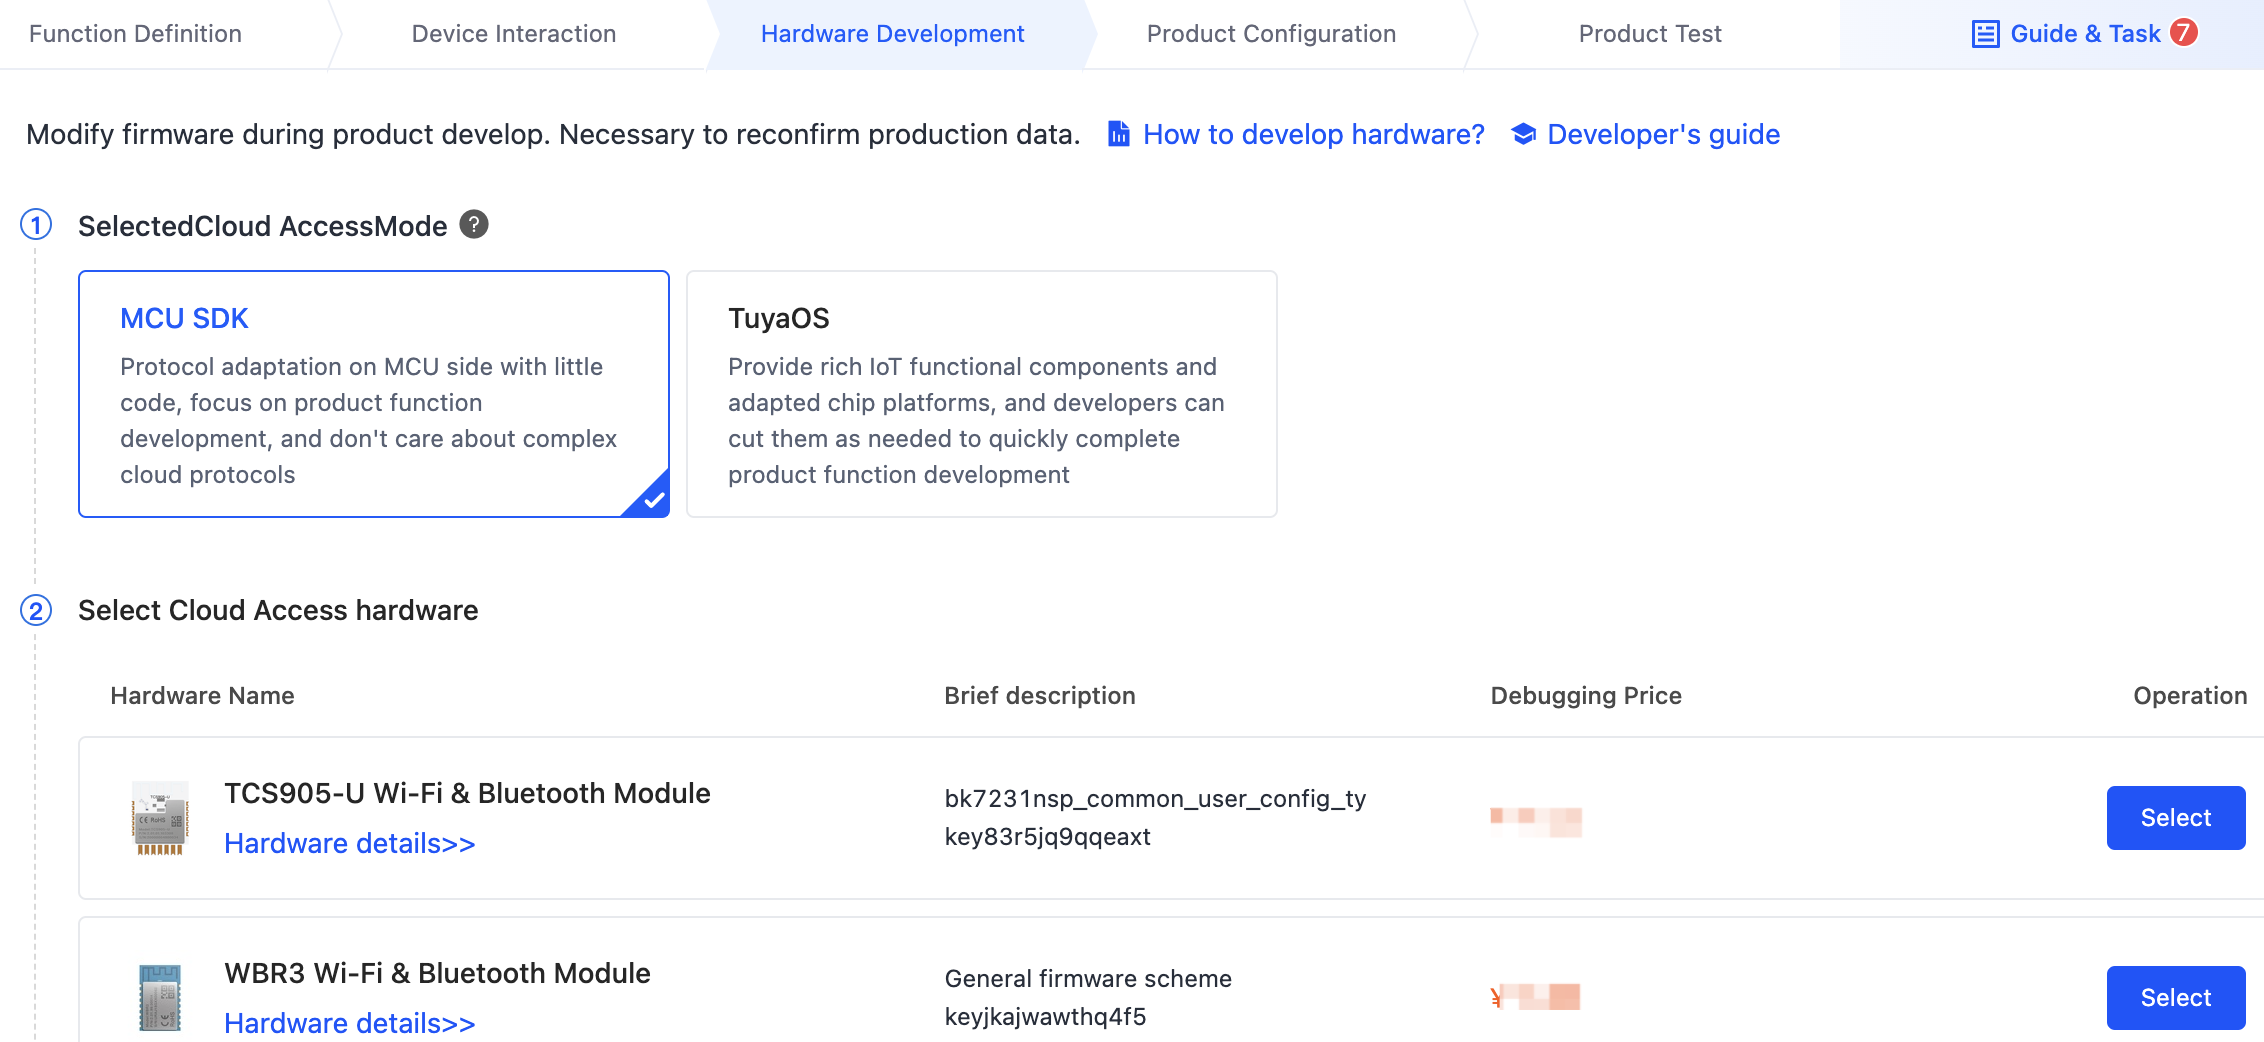
The Module Debugging Assistant works with a JSON configuration file generated based on your defined product functions. You must create a product and define functions before downloading the debugger.
Work mode
The Module Debugging Assistant is integrated with all Tuya-enabled wireless protocols. You must choose the specific protocol you are working on. This debugger supports two modes, MCU simulation mode and module simulation mode.
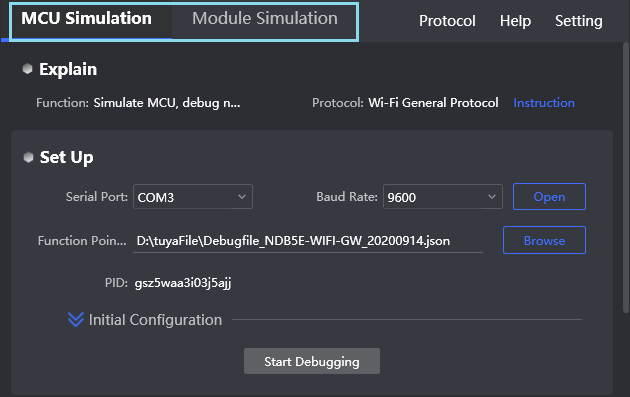
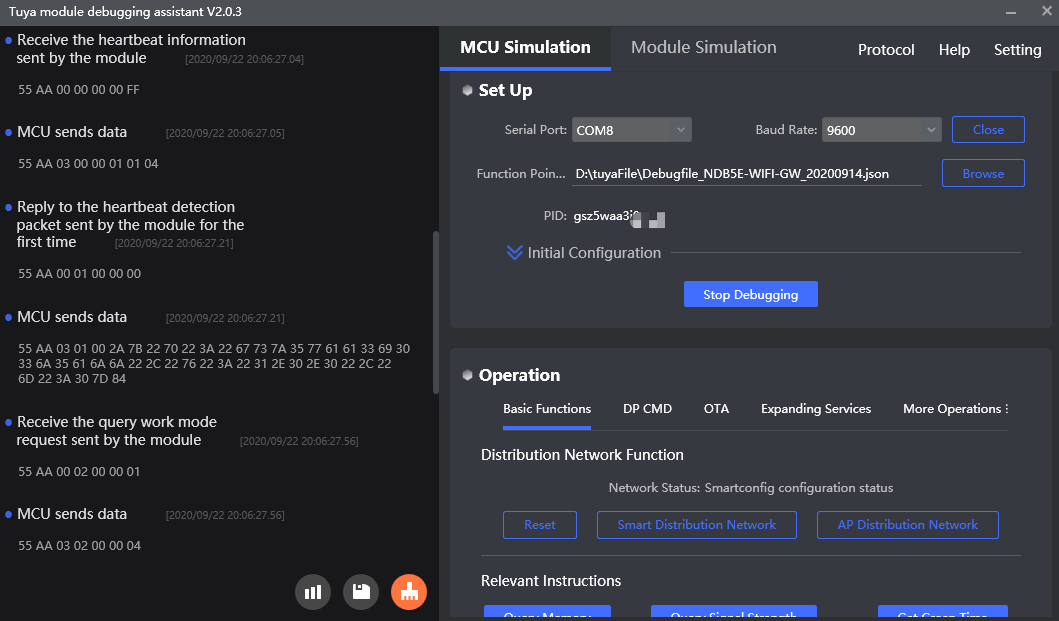
MCU simulation mode
The Module Debugging Assistant simulates the MCU. The computer connects to a Tuya network module through a serial port. After power on, the module will start the initial data exchange, and the assistant will automatically respond to messages from the module as an MCU. This mode enables you to connect the module with the SmartLife app and review data exchange. After you get a module, you can try the following.
- Familiarize yourself with how data exchange works.
- If you encounter any issues while debugging, you can use this mode to identify and address the problems.
Module simulation mode
The Module Debugging Assistant simulates the network module. The computer connects to an MCU through a serial port. The assistant will start the initial data exchange and check the response from the MCU. With this mode, you can test the code after porting the MCU standard protocol and detect any issues. Before connecting to the actual module, verify your code using this mode to minimize potential issues.
The module simulation mode only verifies the communication between the MCU and the module and does not provide real networking capability. After finishing the test, you can connect the MCU to the actual module and test pairing functionality and specific features.
User interface
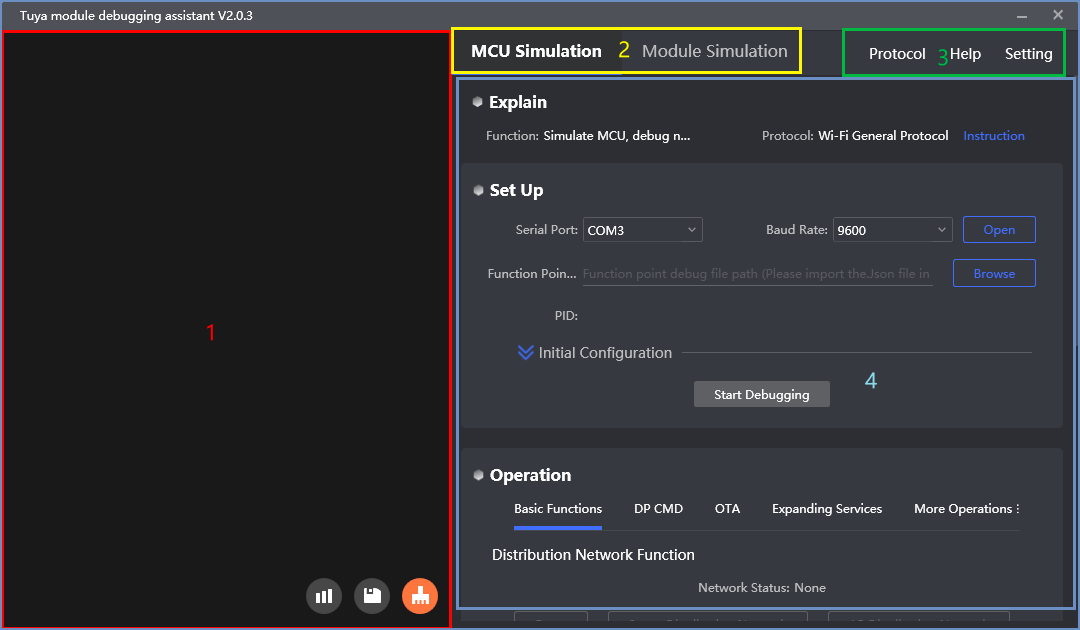
The user interface of the Module Debugging Assistant is divided into four sections.
-
The screen on the left displays serial data, showing both received and transmitted frames, along with key data parsing. The three buttons in the lower right corner, from left to right, are used for:
- Display data
- Save the displayed data
- Clear the displayed data
-
Switch between modes. The assistant can work in two modes: MCU Simulation and Module Simulation, simulating the MCU and module, respectively.
-
Configure the general settings. Protocol is used to switch to another protocol. Help offers accessibility features. Setting allows you to set parameters for interface display and data exchange.
-
The feature operation section includes descriptions, setup, and operation. It shows the chosen protocol and instruction link, along with configuration options for initiating debugging. The debugging features may vary depending on the configuration options.
Usage instructions
MCU simulation mode
The assistant simulates the MCU and performs a pairing test after connecting to a module.
In the early phases of development, you can learn how data exchange works. During functional testing, the assistant can help you identify and resolve issues.
-
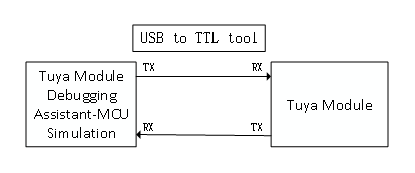
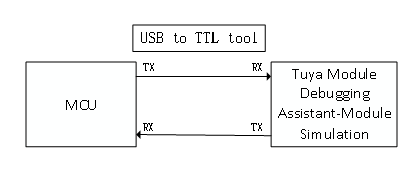
Connect hardware.
Connect the serial port on the module to the one on the computer using a USB to TTL converter.
-
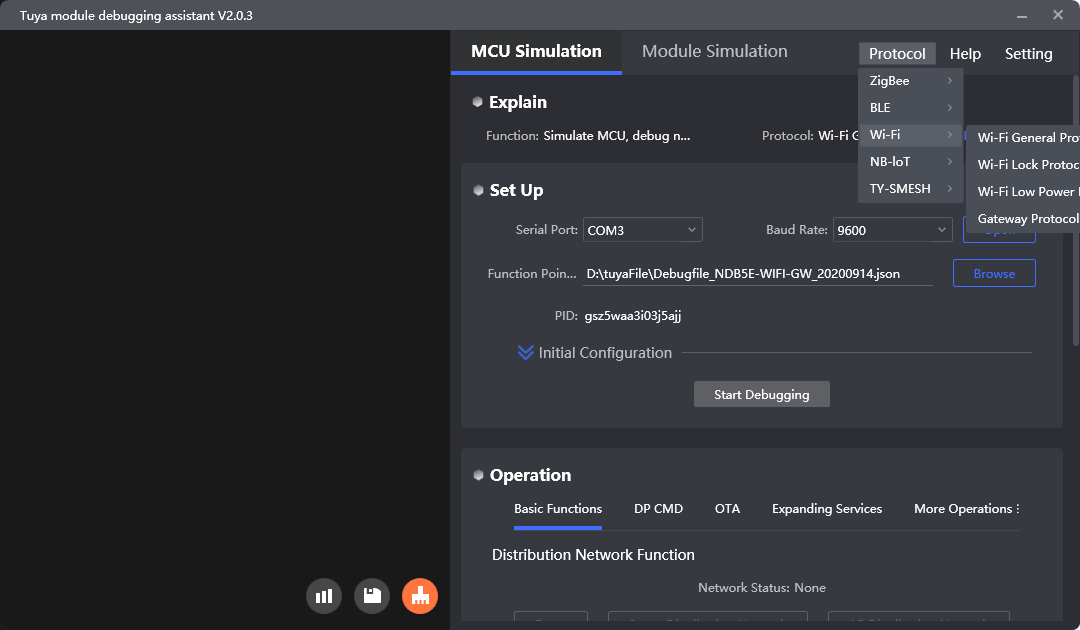
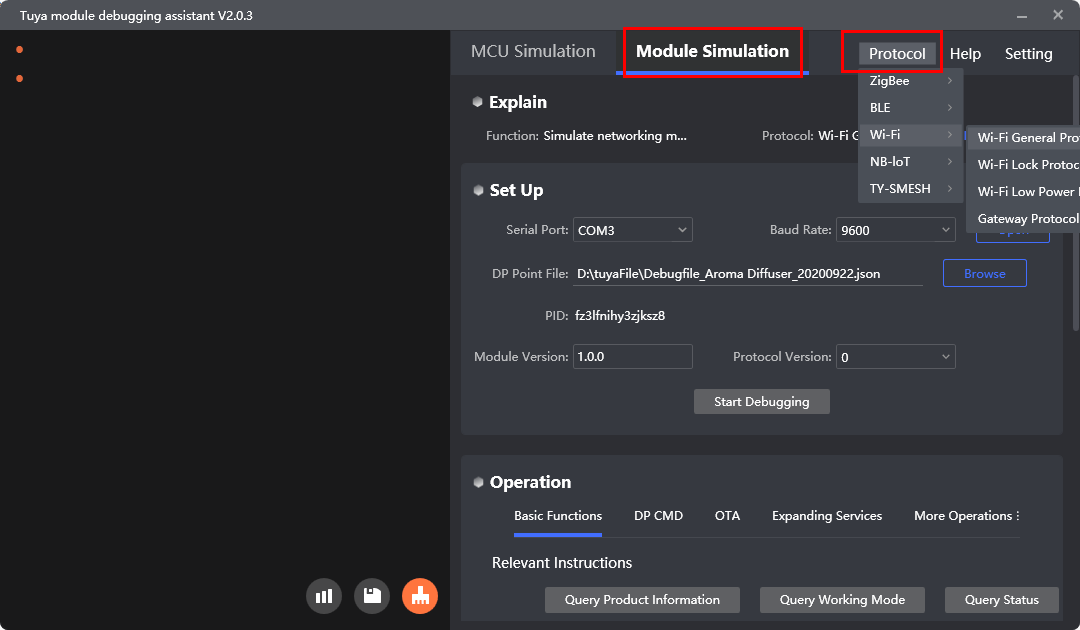
Choose the protocol.
Use the Wi-Fi general protocol as an example. Choose Protocol > Wi-Fi > Wi-Fi General Protocol. Click MCU Simulation to open the debugging interface.
-
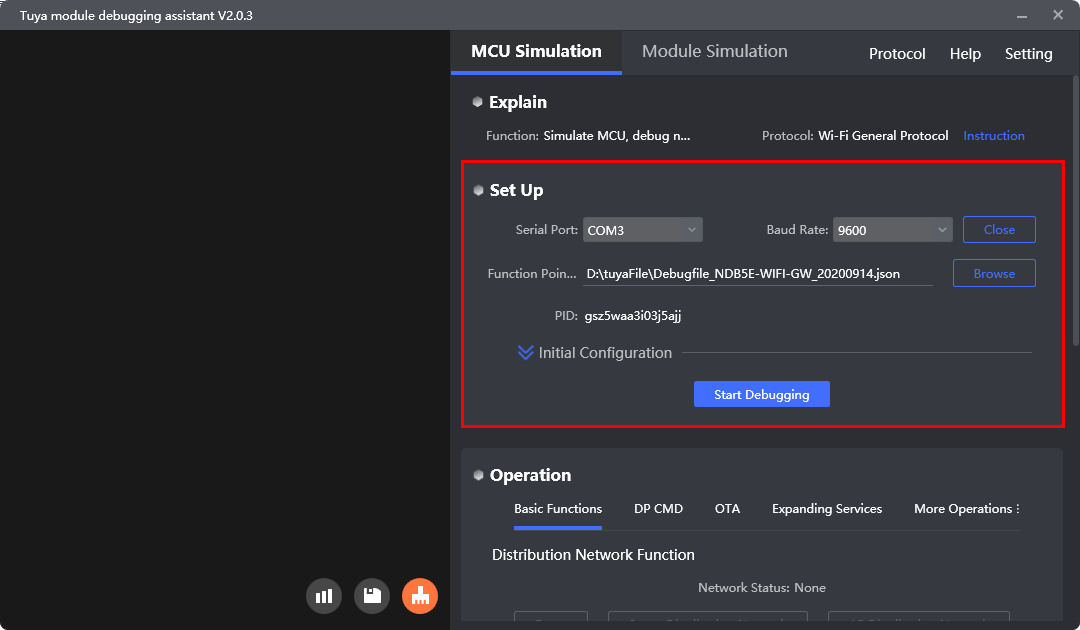
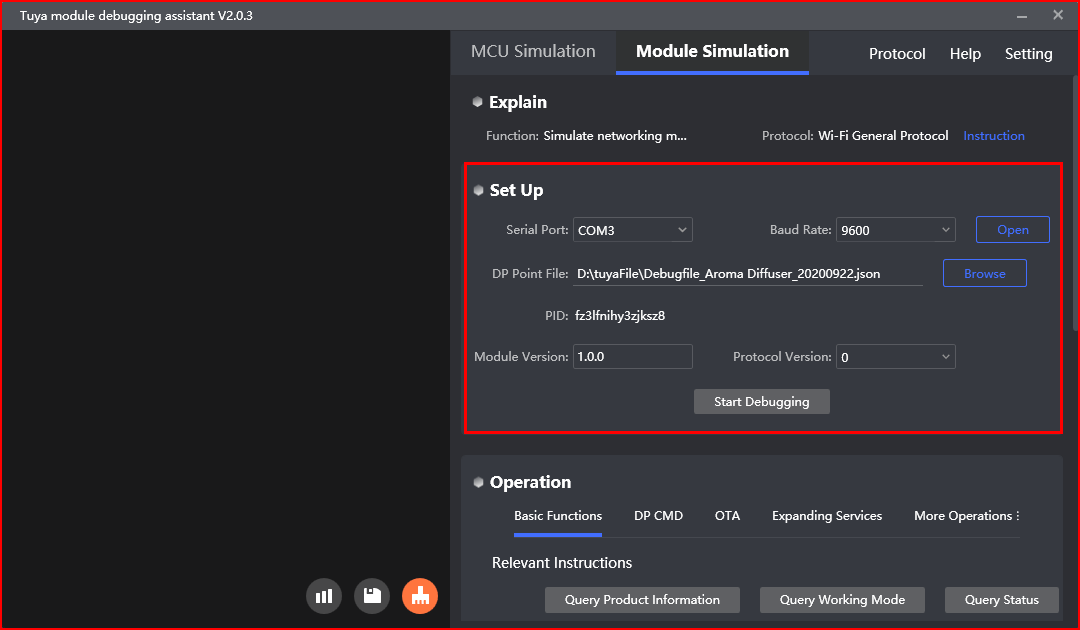
Configure the startup parameters.
-
Select the correct serial port and baud rate, and click Open.
-
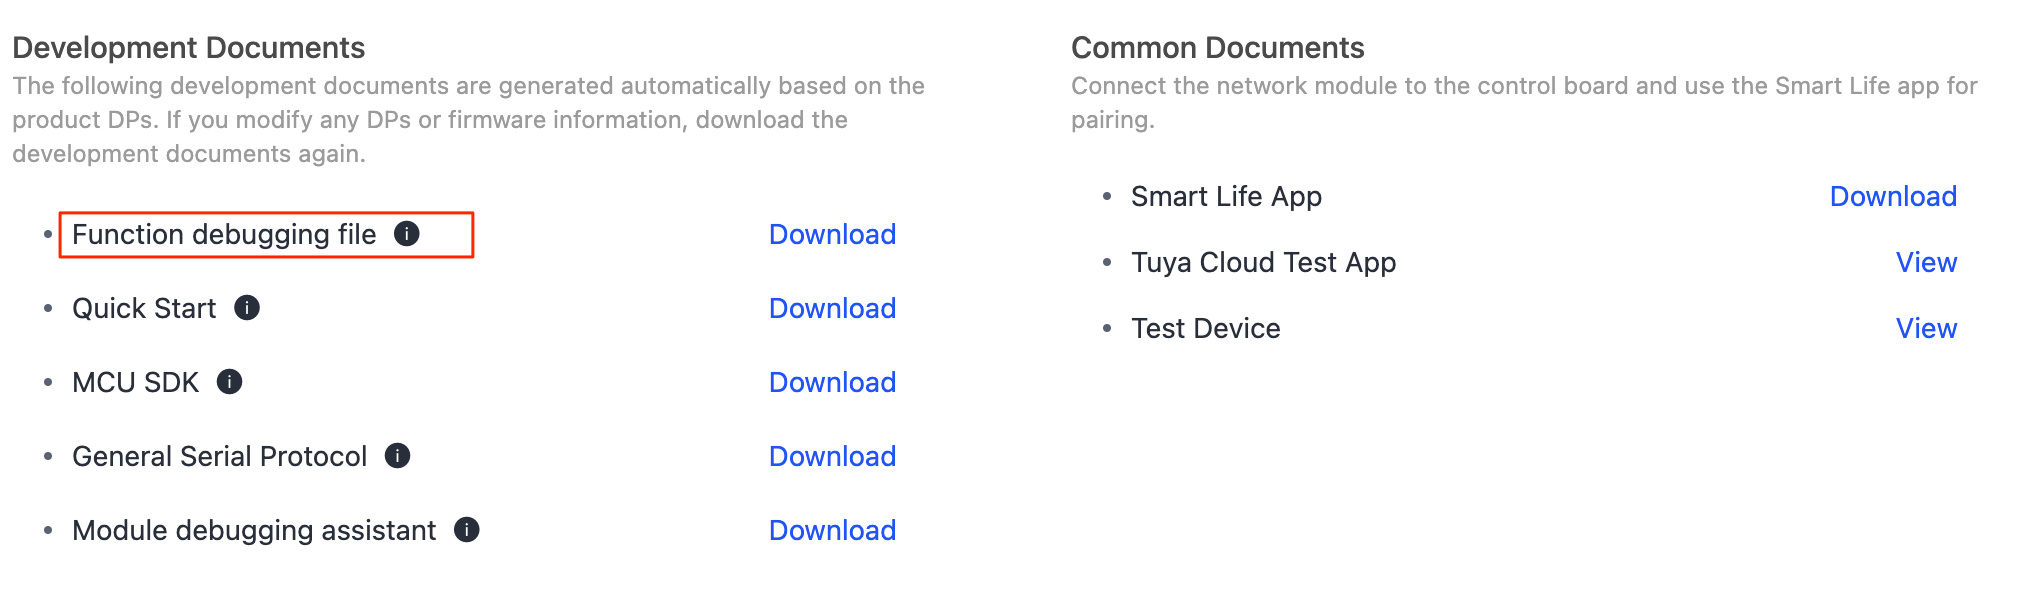
Click Browse to import the debugging file.
Go to the Tuya Developer Platform and open the target product. In Hardware Development, scroll down to Download Documents and download the function debugging file.
-
Click Start Debugging to initiate debugging. You can modify the initial parameters when needed or keep them as they are.
-
-
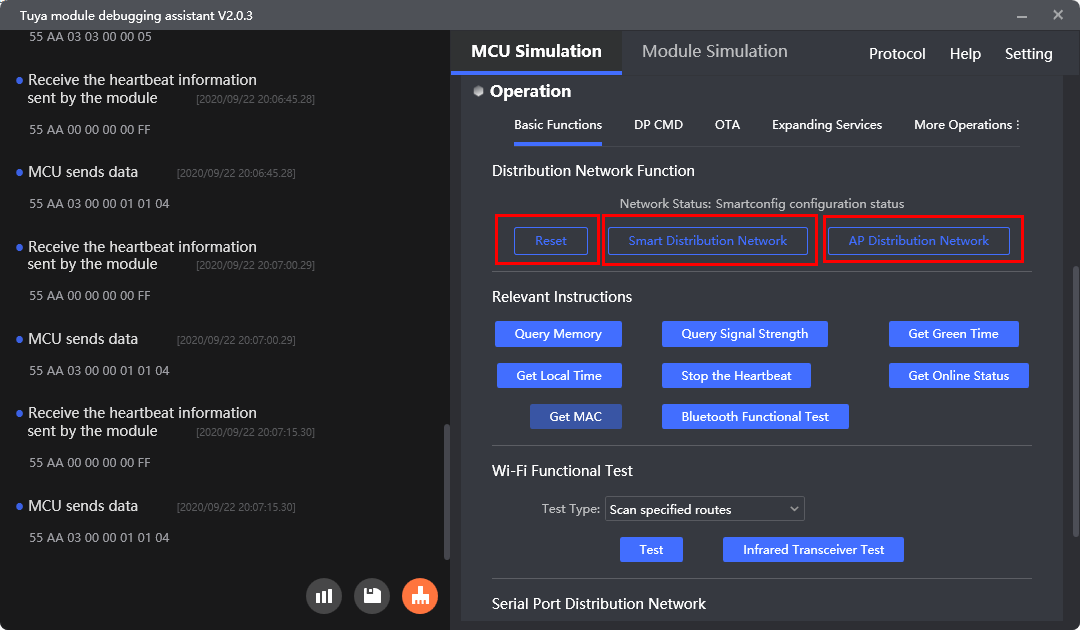
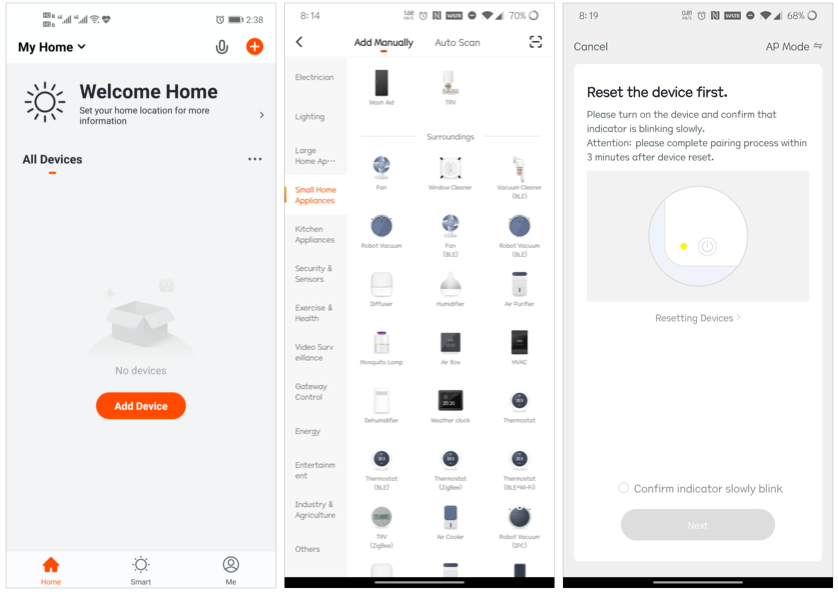
Start a pairing test.
-
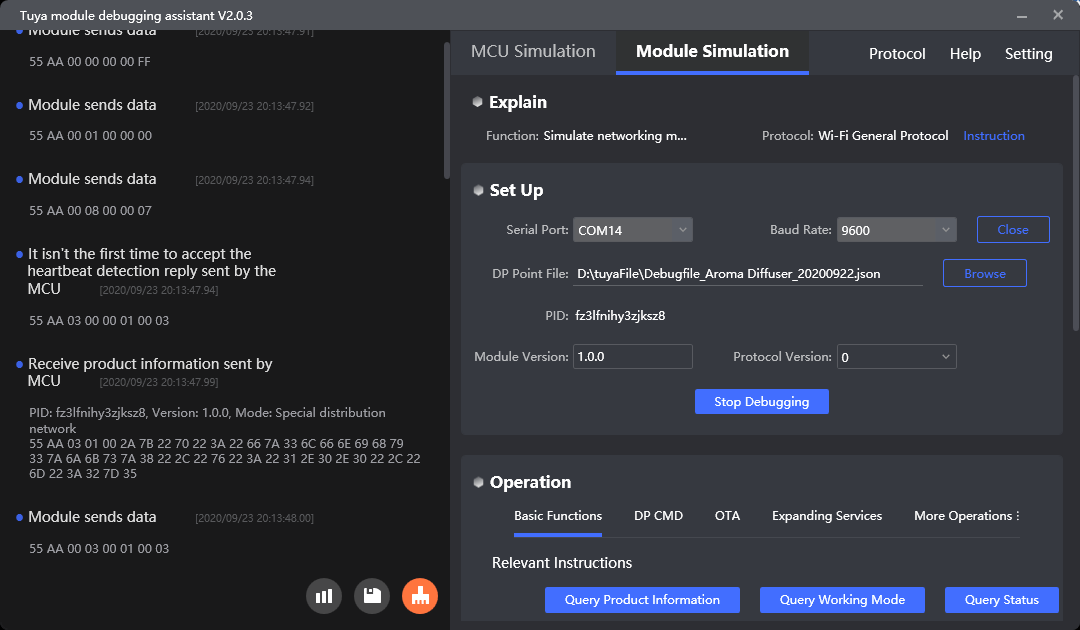
After the debugging starts, check the heartbeat packet and initialization data from the module.
If the host receives no data, check the hardware connection, power supply, and TX and RX connection, and then power on the module again.
-
Click Reset, Smart Distribution Network, or AP Distribution Network to put the module in pairing mode.
-
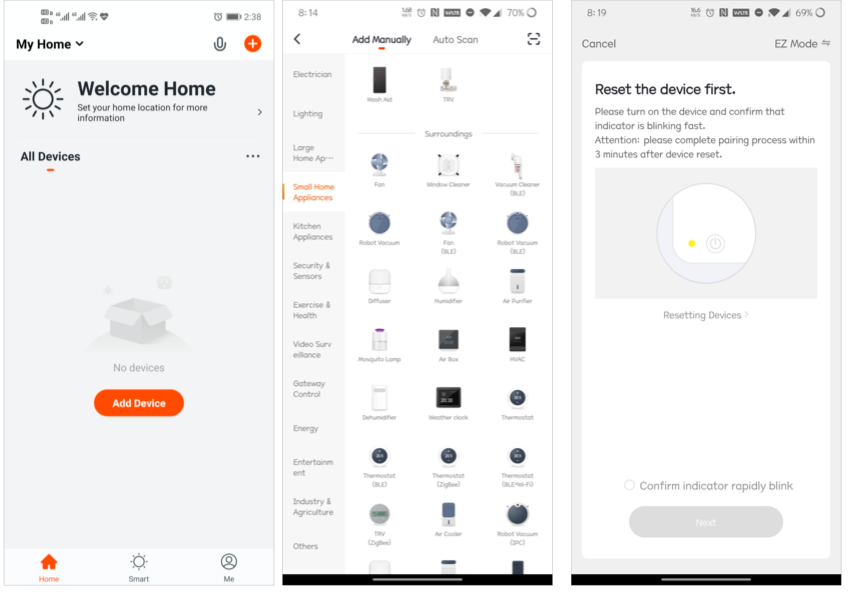
Open the SmartLife app for pairing.
-
Smart pairing: One-to-many advertising mode, with a user-friendly setup process. Pairing may fail in complex network environments or if the router does not support smart pairing.
-
Open the app and tap + in the top right corner.
-
Choose the target device, using the air purifier as an example.
-
Tap Confirm indicator rapidly blink.
-
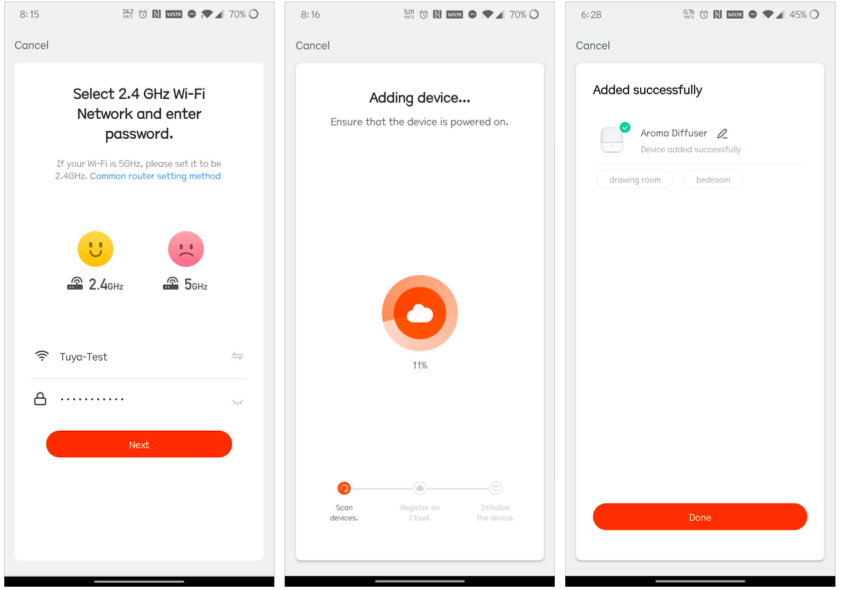
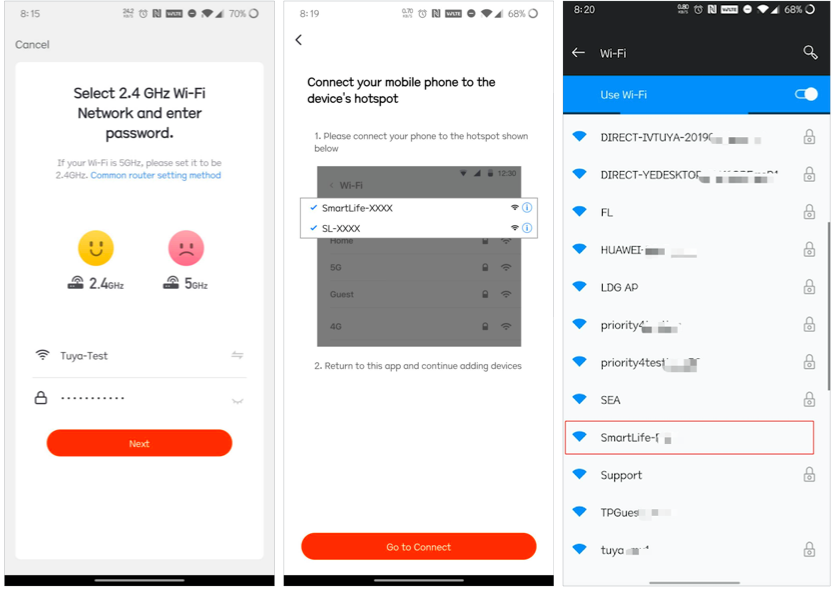
Enter the Wi-Fi password.
-
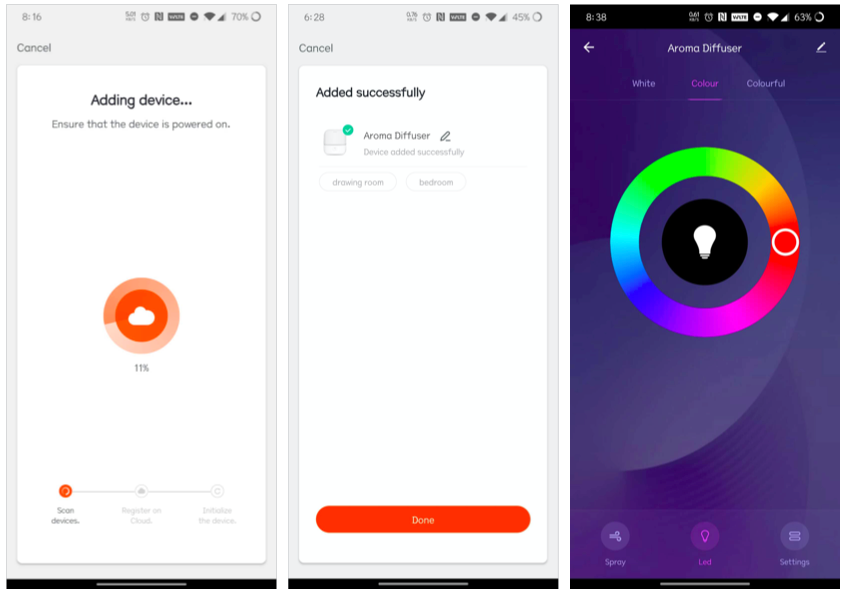
Wait for the pairing to finish.
-
-
Access point (AP) pairing: One-to-one mode with a relatively complex setup process but a high success rate of pairing.
-
Open the app and tap + in the top right corner.
-
Choose the target device, using the air purifier as an example.
-
Tap Confirm indicator rapidly blink.
-
Tap the switching icon in the top right corner and select AP Mode.
-
Tap Confirm indicator rapidly blink.
-
Enter the Wi-Fi password.
-
Connect your phone to the access point emitted by the device.
-
Wait for the pairing to finish.
-
-
- The Wi-Fi module status should match the pairing status shown on the app. If there is a mismatch, adjust the pairing status of either the device or the app to ensure consistency.
- Use the 2.4 GHz Wi-Fi network. Currently, Wi-Fi devices with the Tuya module only support 2.4 GHz networks.
- Make sure to enter the correct Wi-Fi password.
- Minimize the distance between the router, phone, and device.
-
-
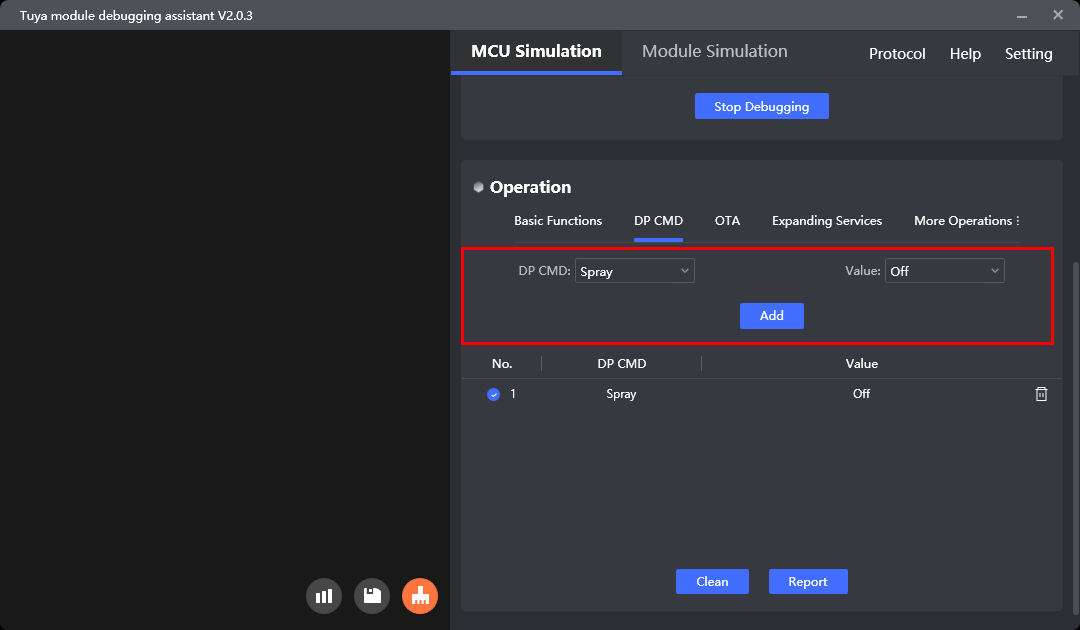
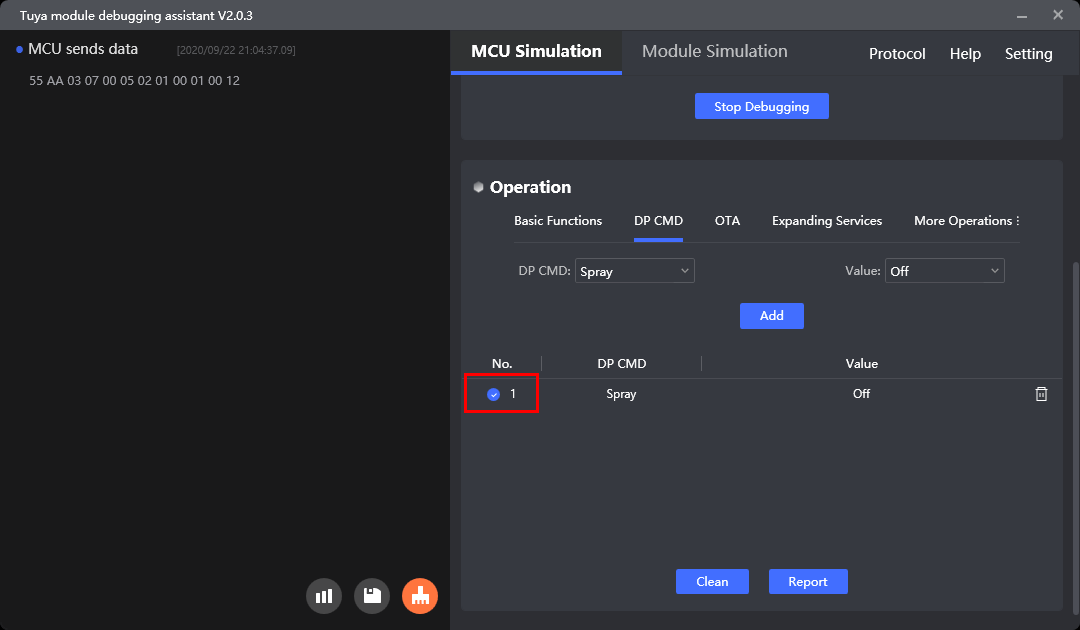
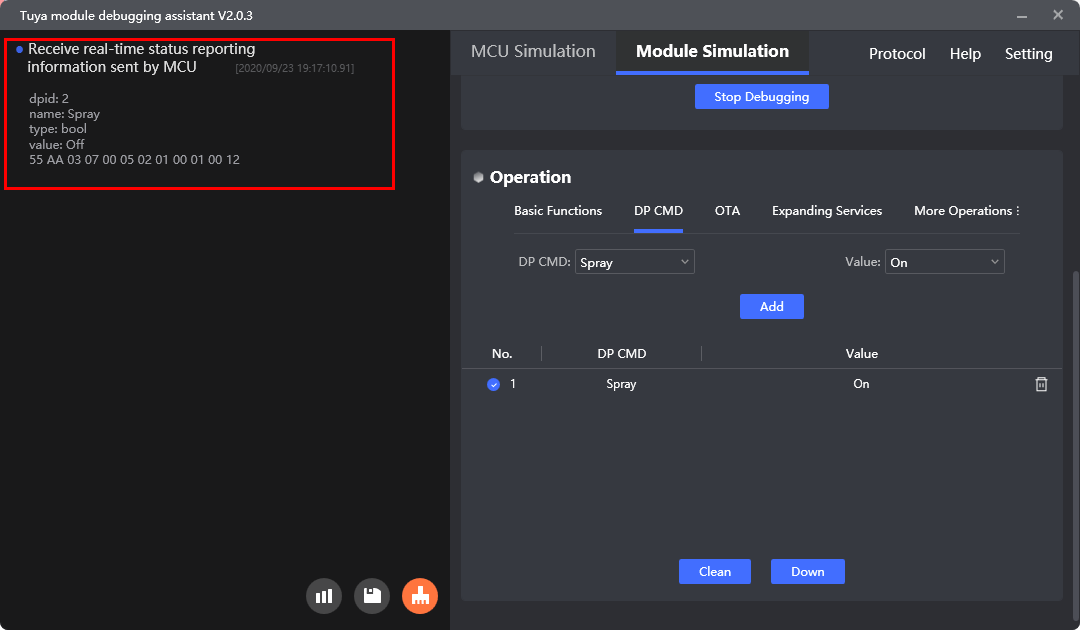
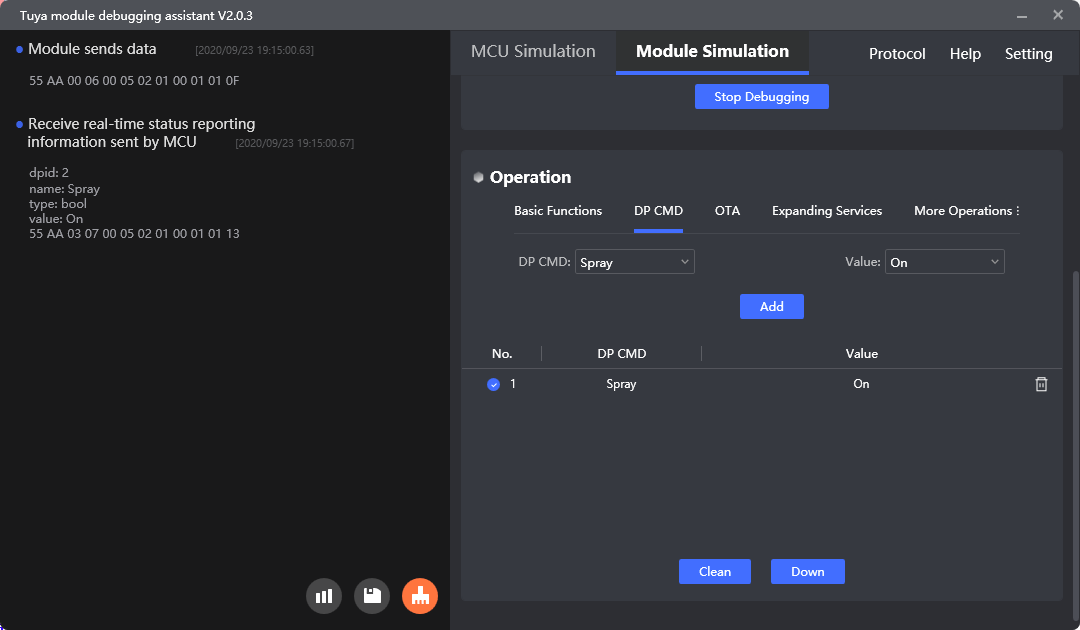
Test data point (DP) reporting.
After pairing is done, select a DP in the DP CMD tab to initiate reporting. The app will then update the panel with the received data. This can help you test panel display issues and review the correct format for DP reporting data.
Click Report to open the testing page.
-
Select a DP command: The options in the dropdown list correspond to the
namefield in the imported function debugging file. -
Enter a
Value: Select or enter a value. -
Click Add. The selected DP commands and values are included in the list.
(Optional) Click Clean to remove the selected items from the list.
-
Click Report to report the DP data according to the setting.
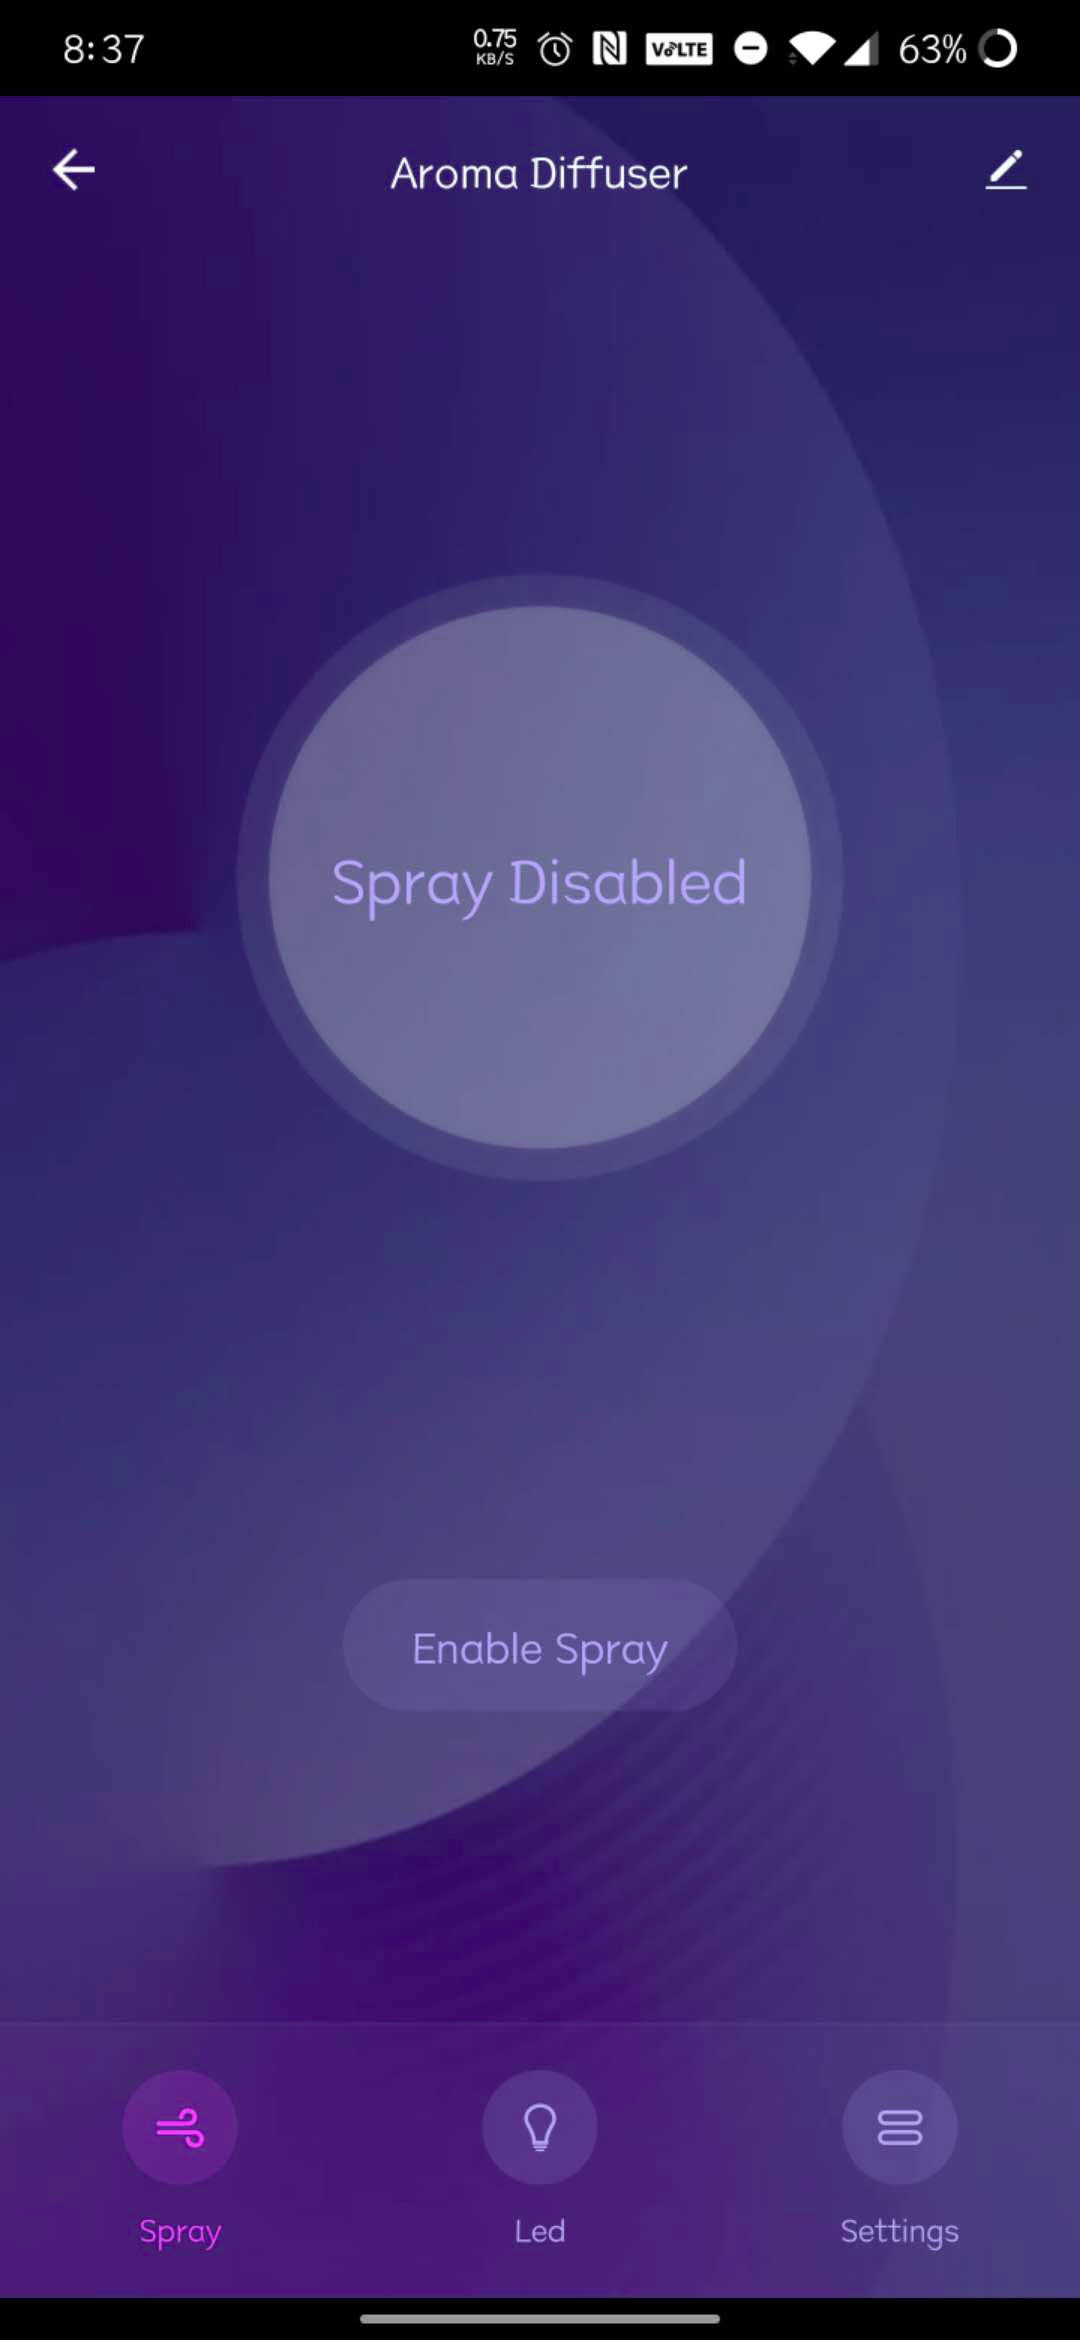
After the switch is set to Off, the left screen displays the reported data and the app shows Spray Disabled.
-
-
Test DP sending
After pairing is done, you can send a DP command using the app. The MCU should respond with the correct data to the command received.
After you tap the switch button in the app, the panel’s background color changes. The left screen of the assistant shows the data received and the MCU response.
Module simulation mode
After finishing the MCU code, you can verify it using the module simulation mode. In the module simulation mode, the assistant automatically sends the initial data to the MCU to check whether the communication works properly. An error message will be returned if any issue occurs. After initialization, you can test different features.
Choose the protocol based on the module you are using. This section takes the Wi-Fi general protocol as an example to show you how to test the communication between a module and an MCU.
-
Connect hardware.
Connect the serial port on the MCU to the one on the computer using a USB to TTL converter.
-
Choose the protocol.
Choose Protocol > Wi-Fi > Wi-Fi General Protocol. Click Module Simulation to open the debugging interface.
-
Configure the startup parameters.
-
Select the correct serial port and baud rate, and click Open.
-
Click Browse to import the debugging file.
-
Click Start Debugging to initiate debugging. You can modify the initial parameters when needed or keep them as they are.
-
-
Test functionality.
-
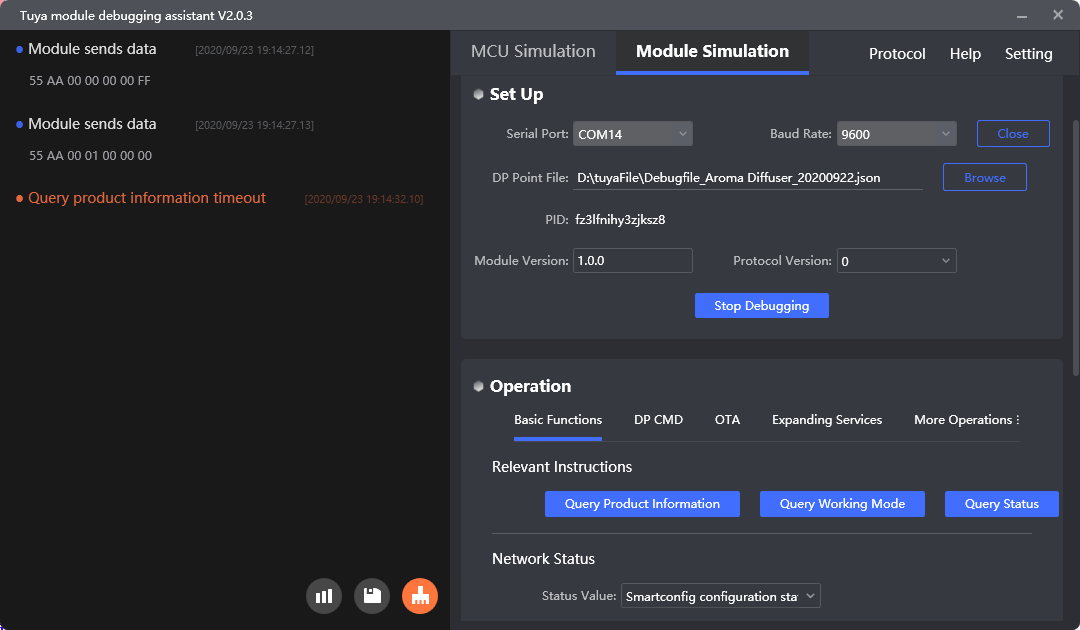
After debugging starts, the assistant will automatically send an initialization command. If the MCU responds correctly, the initialization process will proceed as expected.
-
If the MCU responds incorrectly or fails to respond within the timeout, you will receive a prompt.
-
After initialization is completed, you can proceed to test other features.
-
-
Test DP reporting. After receiving the DP data reported from the MCU, the assistant will parse it.
-
Test DP sending Click the DP CMD tab to open the testing page.
-
The options in the DP CMD dropdown list correspond to the
namefield in the imported function debugging file. -
Select or enter a value.
-
Click Add to include the selected DP command and value in the list.
-
Click Clean to remove the selected items from the list.
-
Click Down to send the selected DP command to the MCU. The assistant will verify the MCU response.
If the MCU does not execute the command you sent, review the logic of the MCU code. For example, when the assistant sends a command to turn off DP1 (switch), the MCU should turn the switch off and report the DP1 (switch) status as off.
-
Other features
Protocol
Switch to the desired serial protocol, such as Wi-Fi, Wi-Fi and Bluetooth combo, Bluetooth, Zigbee, NB-IoT, and LTE Cat.1. A new protocol will be added as products evolve. You will receive a prompt to install any available updates.
Set
-
Language
Click Setting > Language to change the interface language.
-
Parameters
Click Setting > Set Up to configure global parameters for DP reporting.
Here is the interface:
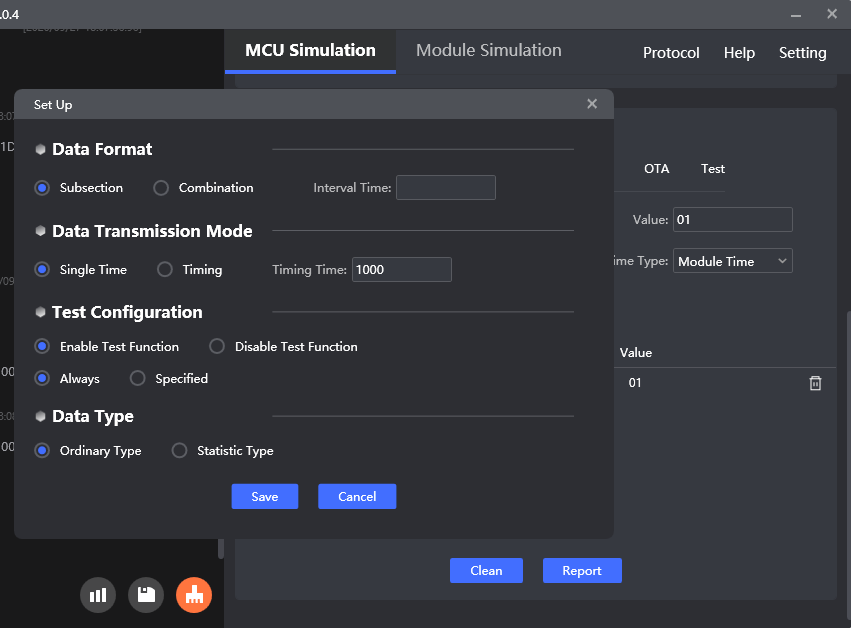
The time unit is in milliseconds.
Parameter Description Data Format Specifies how data is reported, either in a subsection (data reported multiple times) or combination (data reported all at once) manner. The interval time is the frequency at which data is reported in a subsection manner. Data Transmission Mode With single time, data is sent only one time. Timing enables you to schedule data transmission at the specified interval. This parameter is used for DP sending, reporting, and testing. Test Configuration It is valid only for testing. You can choose to send commands continuously or at specific time intervals. Data Type Specifies the type of data reporting. Data is reported with time in the statistic type, and without time in the ordinary type. Currently, this parameter only applies to the Wi-Fi protocol. -
Serial data processing
The serial port data is displayed on the left screen:
-
Display the received and transmitted serial data.
-
Save the displayed data to the local storage.
-
Clear the displayed data.
-
Help
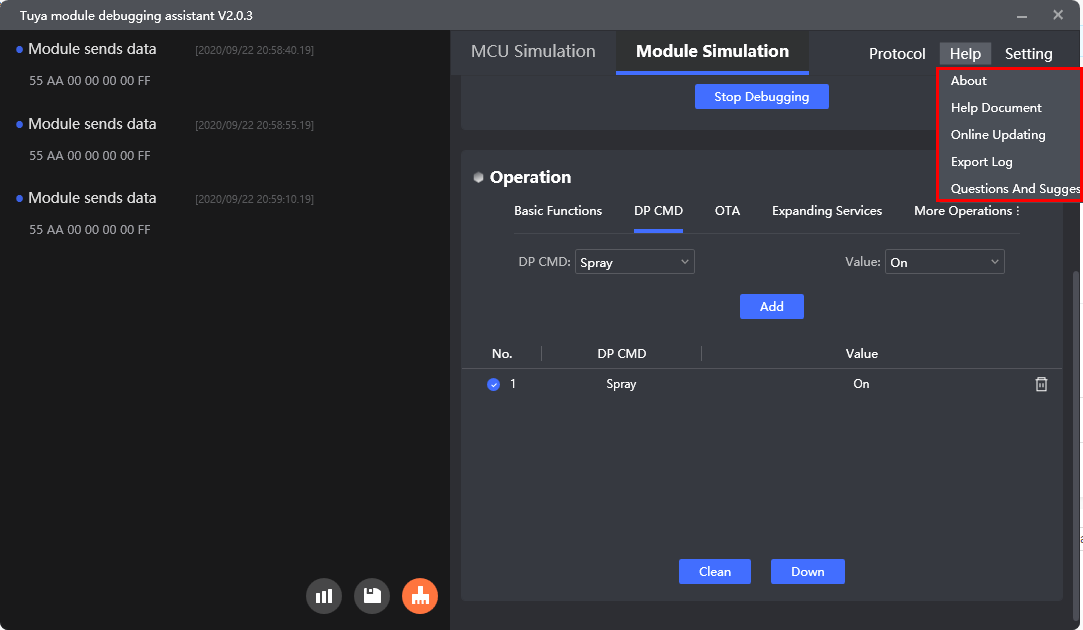
| Option | Description |
|---|---|
| About | View version information. |
| Help Document | Visit the documentation center. |
| Online Updating | Check for updates. |
| Export Log | Export the running log to the specified folder and automatically open the latest log file. |
| Questions and Suggestions | Go to the Tuya Developer Platform to submit a ticket. |
Notes
Running record:
- The software log is stored in
%Appdata%\Tuya\TYDEBUG\logs - The write operation directory of the software file is:
%Appdata%\Tuya%Appdata%\Tuya
Is this page helpful?
YesFeedbackIs this page helpful?
YesFeedback