New Features of Data Service V2.0
Upgraded visual experience
Added multiple visualized charts
Add product distribution and device category linkage modules to be able to view the user’s associated use of devices and understand the user’s real scenarios.
Product distribution chart
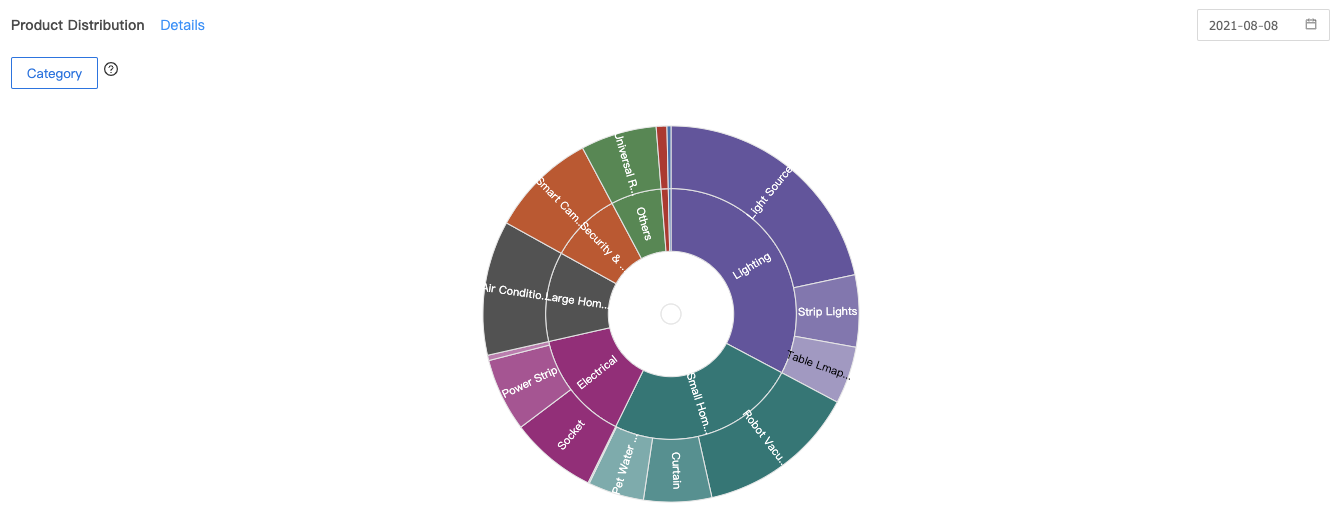
You can view the category data by clicking the category area and clicking the middle dot to return to the previous level.
Scenario linkage analytics chart of a single product

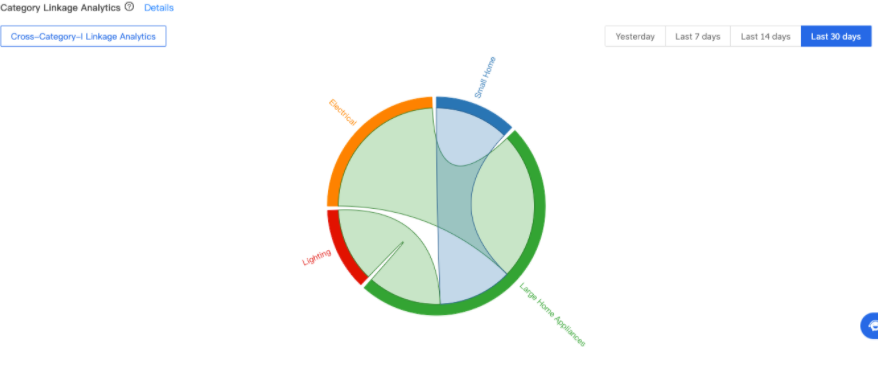
Category linkage analytics chart
Extended the data dimension
Add new indicators such as effective device interaction, active device/user source, active device/user stickiness, to more systematically grasp the current situation of devices and users.
Added data indicators such as effective device interaction
Gain a comprehensive, intuitive, and real-time understanding of device operating conditions. The real-time profile analytics dimension of the day is refined to various time points on the day of the statistics.
For example, you can understand the execution effect of the market strategy and adjust and optimize the market strategy by viewing the trend of device activation at various times on a statistical day.
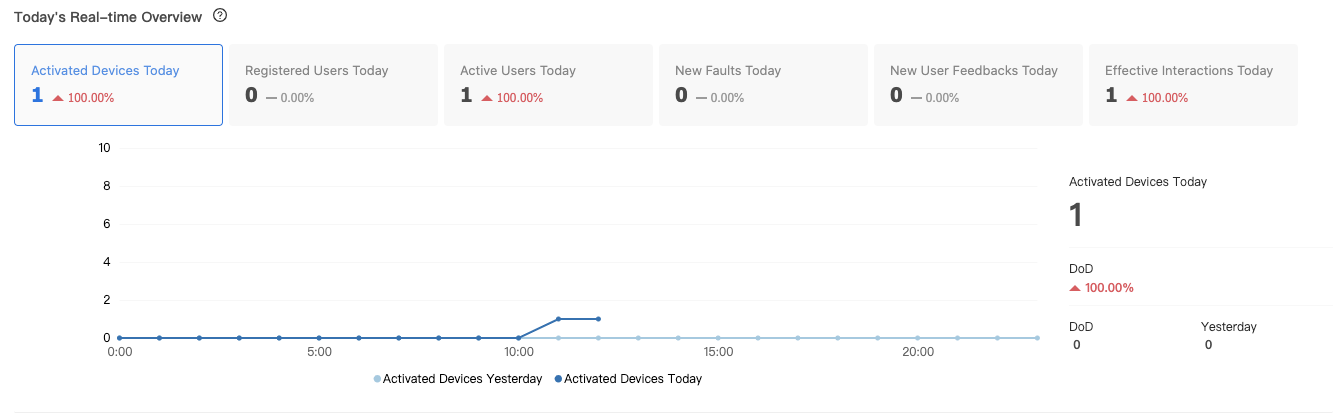
You can go to the Tuya Developer Platform > Data > Device Statistics > Active Data to view the chart.
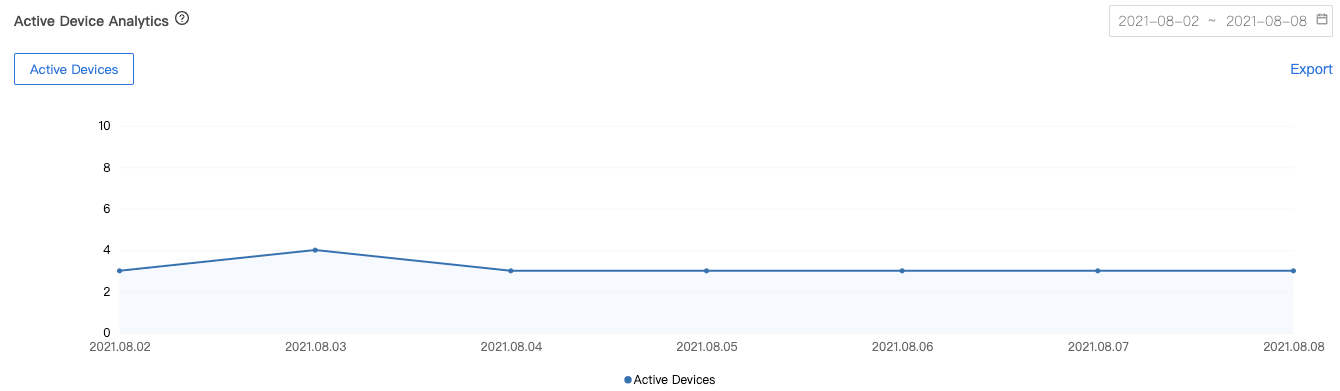
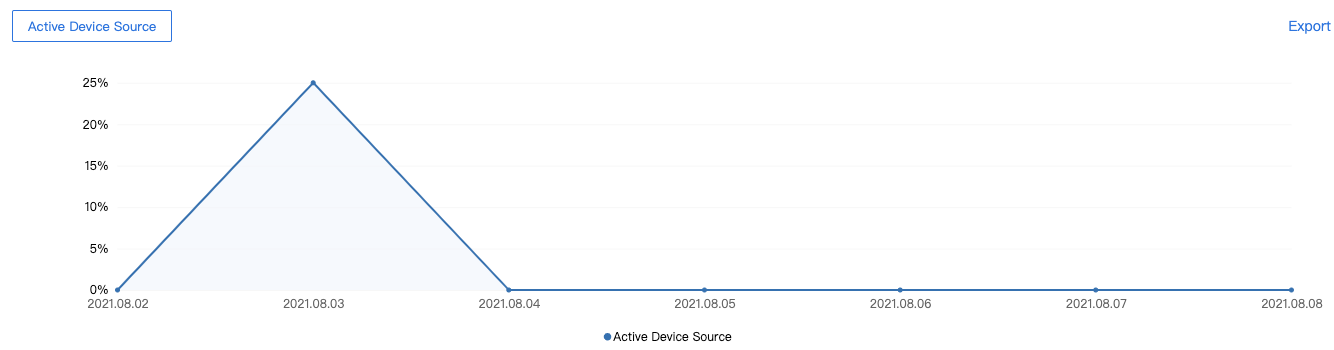
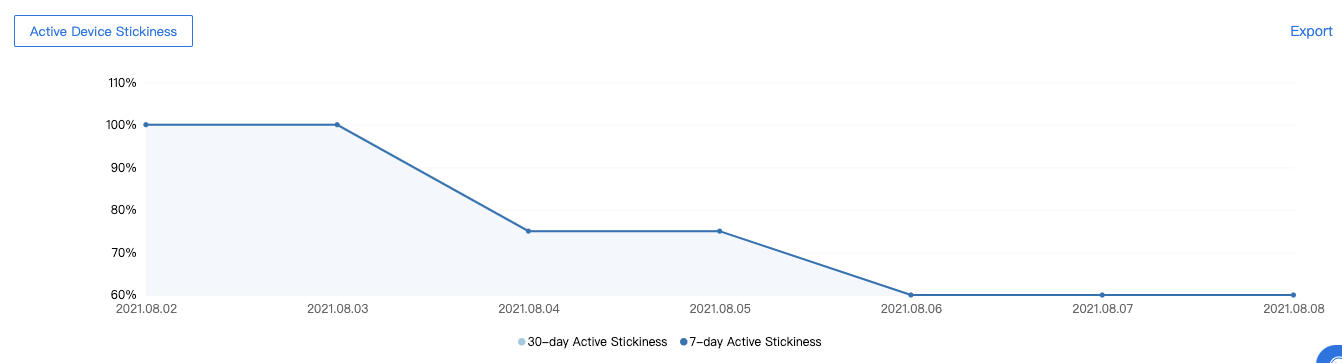
New active device analytics data
Through active device source and stickiness indicators, you can view the active device source and continuous activity of devices.
You can go to the Tuya Developer Platform > Data > Device Statistics > Active Data to view the chart.
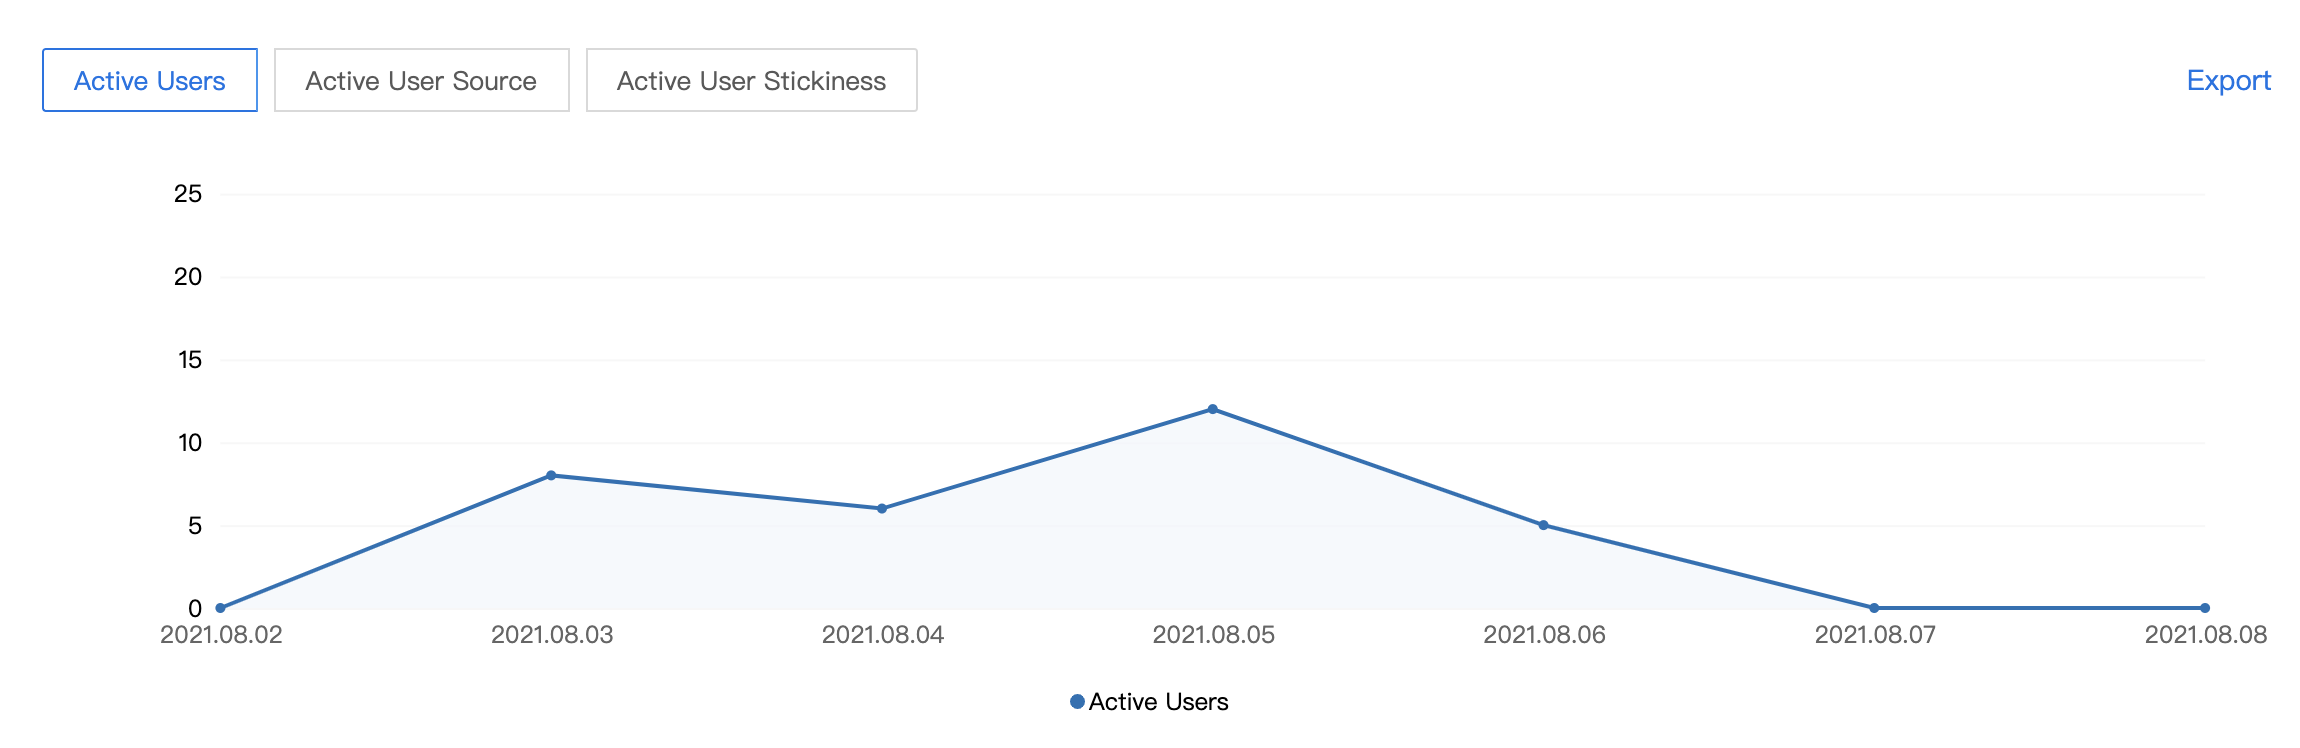
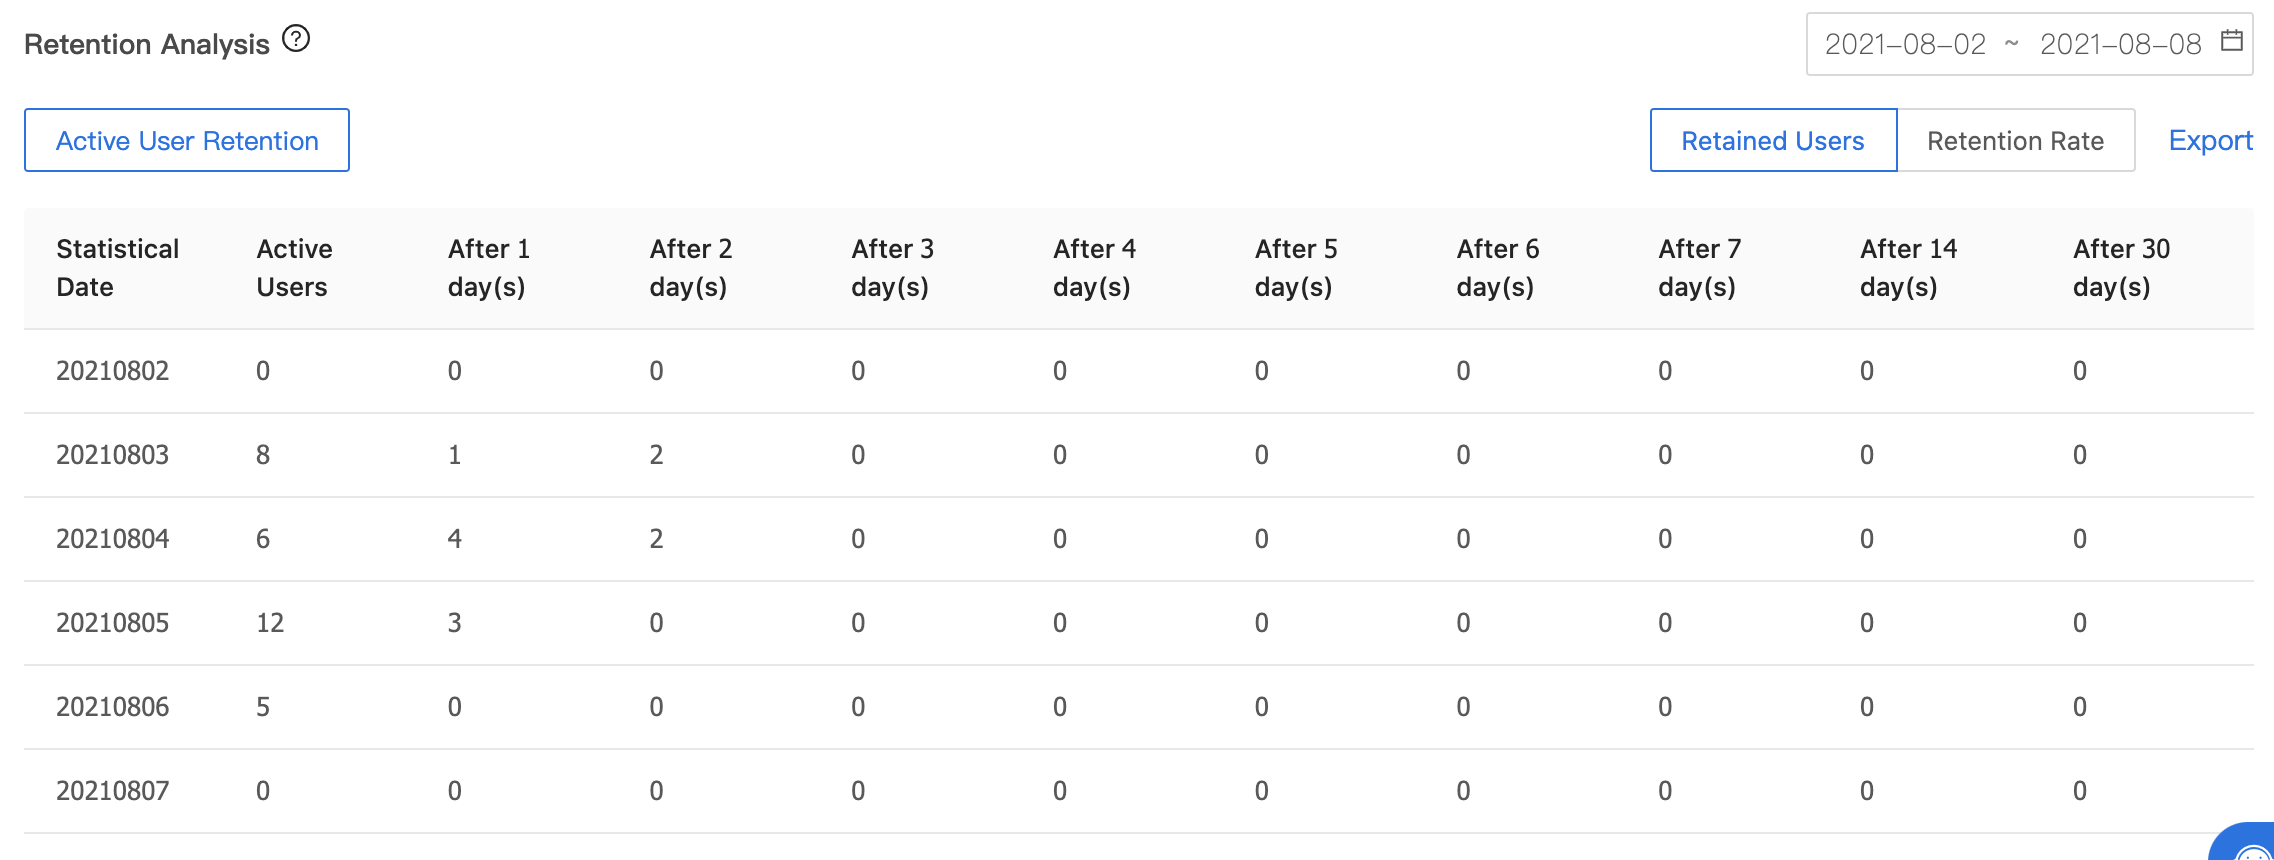
Added analytics on active users and user retention
Provide active user source, stickiness (the last 7 days and the last 30 days), and user retention data. You can view user activity trends, source, and continuous activity at any time. The current status of app user activity can be analyzed in a comprehensive manner, which is of guiding significance to the app and app user operation.
You can go to the Tuya Developer Platform > Data > App Analytics > App Users to view the chart.
For more information about data indicators of each section of the data center, see Data Center.
Is this page helpful?
YesFeedbackIs this page helpful?
YesFeedback