Data Services
Tuya’s Data Services give you a panoramic view of the data used by your devices and apps, helping you implement a variety of business scenarios. Currently, Tuya’s data services comprise Data Dashboard, Data Profile, Data Analytics, and Data Visualization. These services enable you to monitor device data, analyze user behaviors, calculate statistics of faults, and process user feedback.
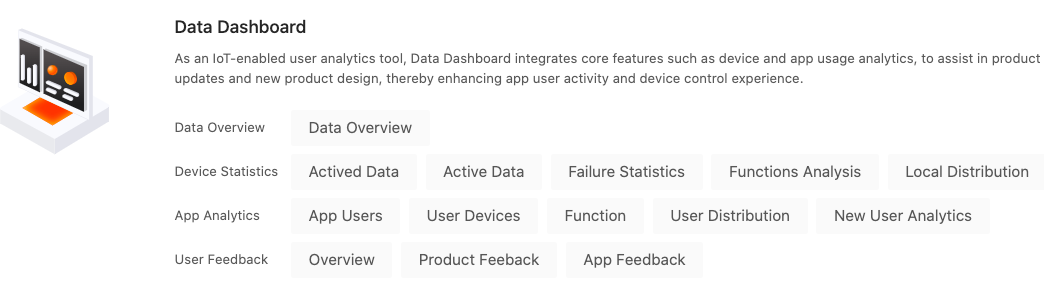
Data Dashboard
Data Dashboard shows you the real-time overview, device data, app usage data, and real-time user feedback. Using the Data Dashboard, you can intuitively and quickly have a glimpse of the overall indicator data for your smart products, OEM apps, and product usage. For more information, see Data Dashboard.
Data Analytics
Based on the smart device data, Data Analytics offers one-stop services covering data integration, cleansing, storage, analytics, visualization, and custom data APIs. You can easily perform development to explore unlimited data value.
You can edit a real-time stream rule engine for data filtering, generate reports and dashboards from the stored data, and package the processed data into a series of APIs for panels or other IoT applications. Relying on a time series database, you can perform time series insight analytics on a specified device or certain assets. For more information, see Data Analytics.
Data Profile
Data Profile is a data service specially designed for OEM app owners. Target users can be filtered by the custom segment, recommended segment, tailored segment, and data profile API requests. Choose the desired marketing channels to suit a specified segment, including email, SMS, app splash screen, app push notification, and third-party marketing system, to achieve refined and precision marketing. For more information, see Data Profile.
Data Visualization
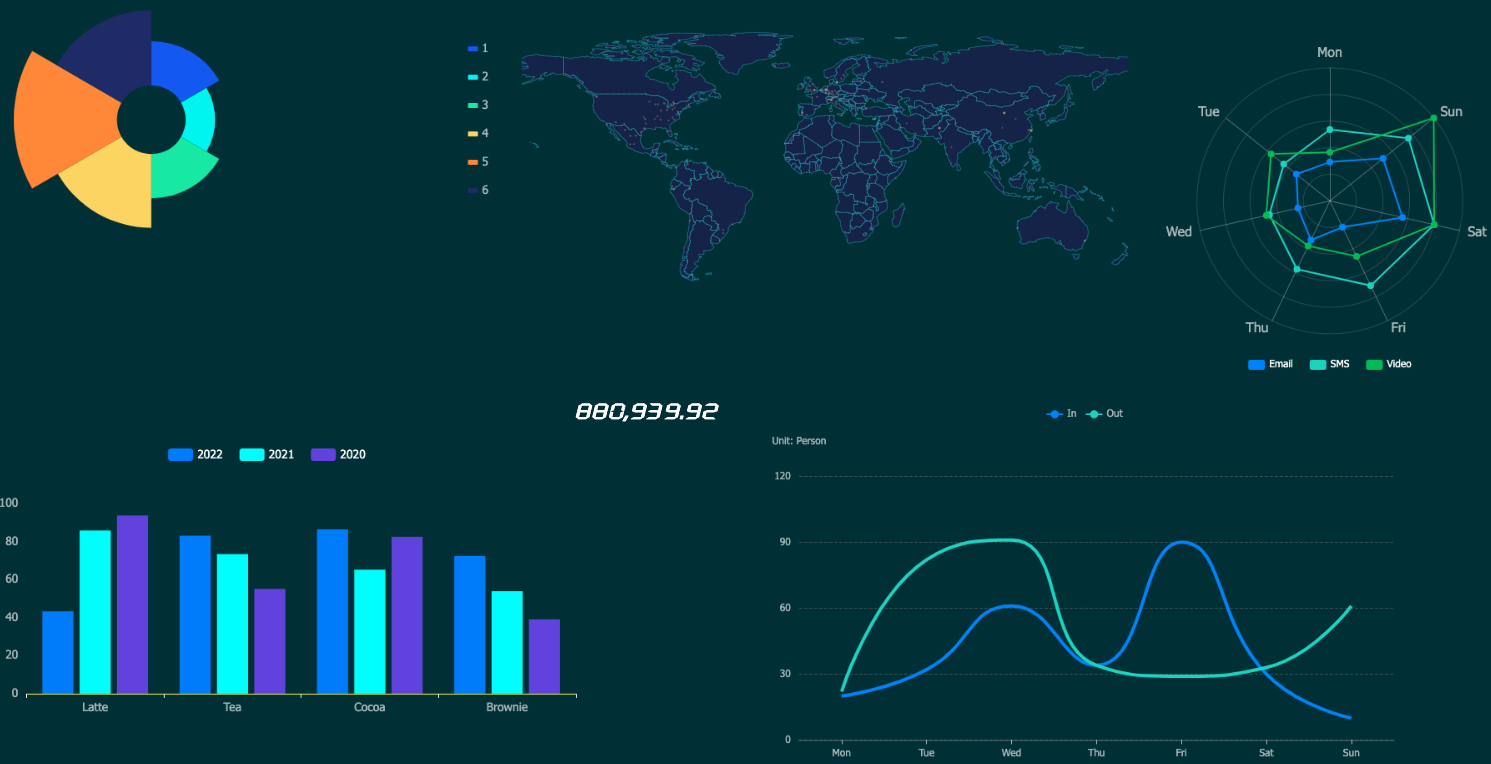
Data Visualization provides you with easy-to-use developer tools to quickly build professional visualization applications. Large amounts of data continuously produced by users can be converged and displayed on a large screen. You can clearly see the operation status of enterprises and projects, helping you make informed decisions. This service applies to a broad range of scenarios such as meeting rooms, business monitoring, and risk alerts. For more information, see Data Visualization.
Is this page helpful?
YesFeedbackIs this page helpful?
YesFeedback