Data Dashboard
Last Updated on : 2024-06-20 06:39:06download
Overview
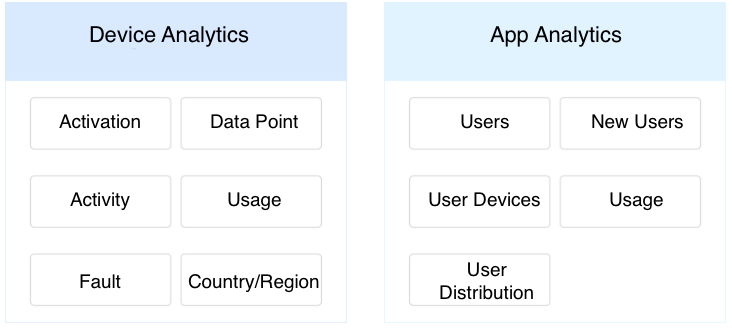
As an IoT-enabled user analytics tool, Data Dashboard integrates core features such as device and app usage analytics and adopts multiple data sources to assist in product updates and new product design. This helps to take app user activity and device control to the next level.

Core features
Device usage analytics
- Scenario: Based on the trend of the device usage, activation, and active retention of the product, you can get to know the users’ usage habits and frequently-used products, and broaden your visions of product iteration and new product design.
- Values:
- Learn about the churn situation and churn stages of activated and active devices, and make operational interventions at the time of high churn to reduce churn and returns of products.
- Use device usage data to understand user preferences, adjust panels and product functions, and enhance the product experience.
Analytics of new app users
- Scenario: Through the success rate of pairing, pairing rate, and pairing data of new users, check whether issues arise in the conversion of new users in the pairing stage, and optimize the operations and technology of the churn stage.
- Values: For smart device apps, adding devices is the basis for app use and smart device control. The conversion of new users who add and use devices is essential for user retention. Based on the analytics of new user conversion, you can evaluate whether users encounter problems in adding and using devices. This allows you to avoid user churn and returns of products.
Analytics of feature usage
- Scenario: Know more about users’ preferences and assist operations based on the usage data of device panel, shortcut functions, scene functions, as well as usage and category distribution of the analytic functions.
- Values: With the analytics of functional data such as the devices and scenes used by the app users, understand better about the users’ preferences, help to optimize app configurations, and increase user activities and stickiness.
User distribution
- Scenario: Gain insights into the number of users in the novice, growth, silence, and churn stages, evaluate the people for whom you must carry out operations, and formulate corresponding operation strategies.
- Values: Provide online smart user analytics and growth tracking. The analytics of user data at different stages allows you to have a comprehensive grasp of the distribution of app users, make accurate decisions on user operations that contribute to the increase of user activity and stickiness.
Is this page helpful?
YesFeedbackIs this page helpful?
YesFeedback


