User Feedback
Last Updated on : 2024-06-20 06:38:04download
User feedback is mainly divided into product feedback and app feedback.
Overview
You can quickly locate problems, improve products, and enhance service quality. The problems reported by users lie in products and apps (OEM app and Smart Life). The distribution diagram can show you data from different aspects, including solved/pending problems, app versions with problems, and product distribution.

Terms
| Term | Description |
|---|---|
| Total user feedback | The total number of feedback submitted by users on the app that is linked with the current account. |
| Product (total user feedback) | The number of product feedback submitted by users on the app. |
| App (total user feedback) | The number of app feedback submitted by users on the app. |
| Pending | The number of unprocessed feedback. |
| Product (pending user feedback) | The number of unprocessed feedback on products. |
| App (pending user feedback) | The number of unprocessed feedback on the app. |
| Today | The total number of feedback submitted by users on the app today. |
| Yesterday | The total number of feedback submitted by users on the app yesterday. |
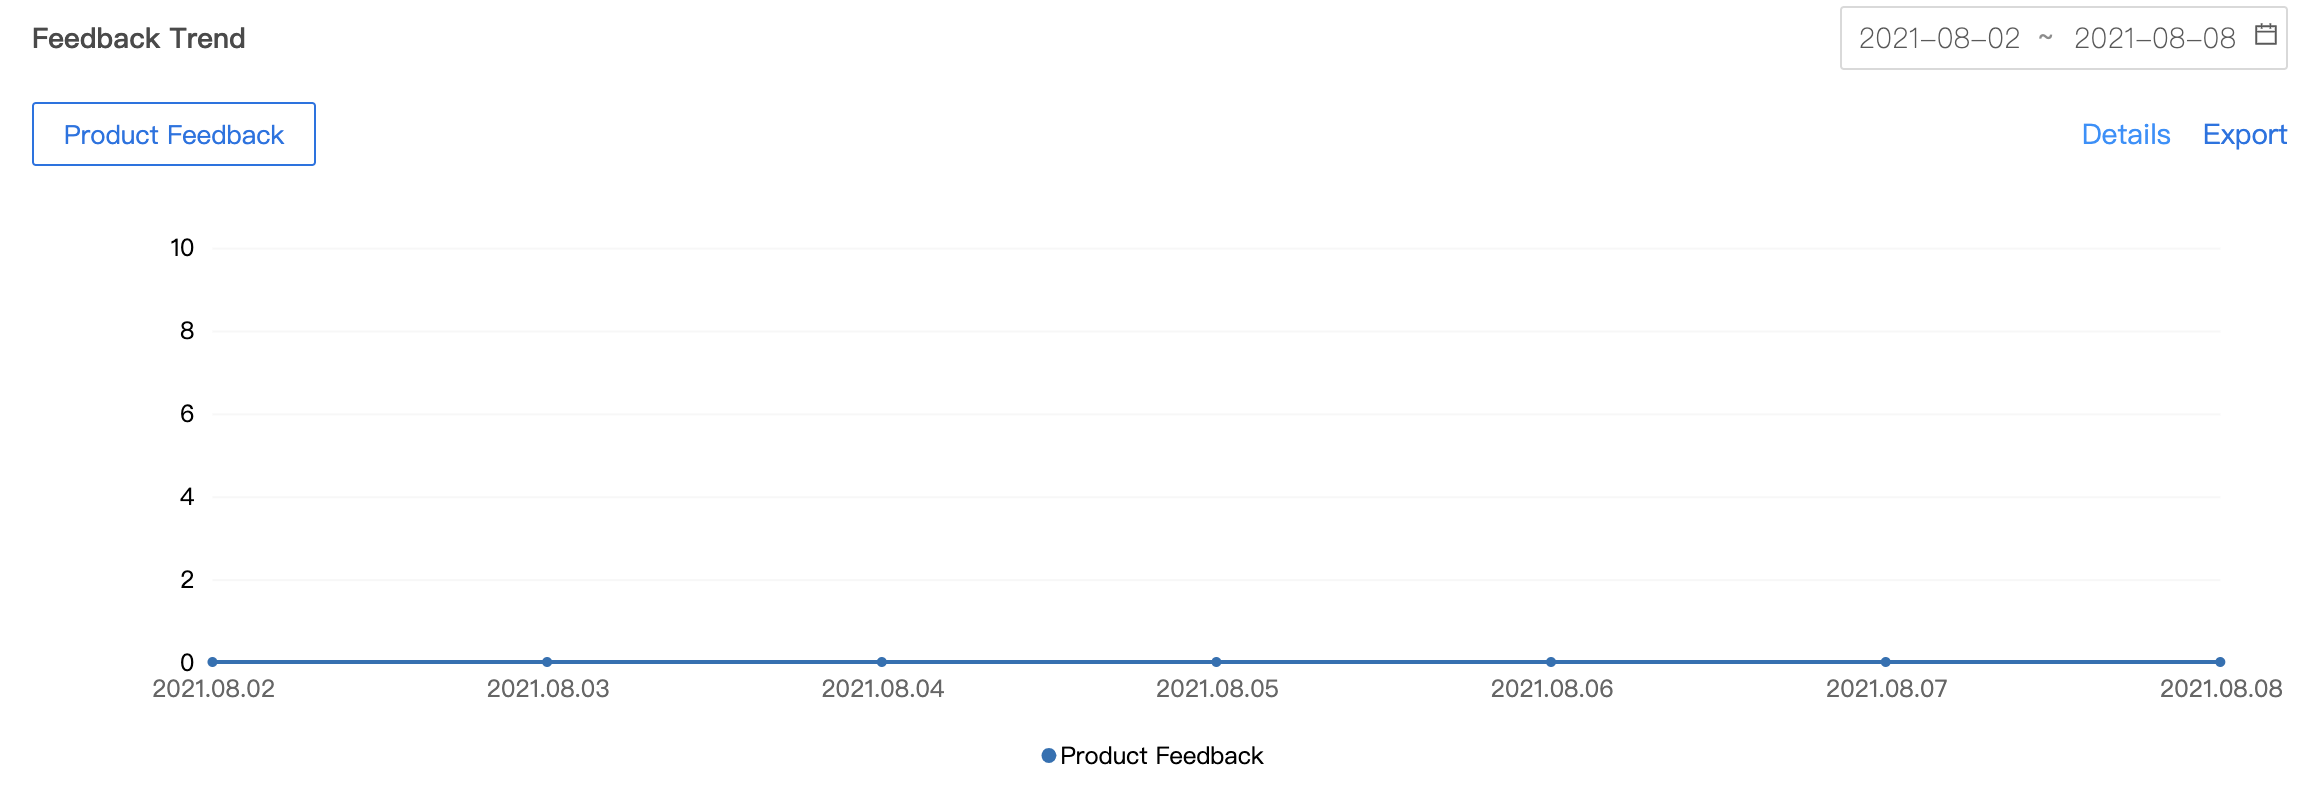
Feedback trend
-
Product feedback: the number of product feedback submitted by users on the app during the statistical period, indicating the problems encountered by users about product use. It shows the number of total and new feedback, pending feedback, distribution, and response time. Analyze user feedback issues in multiple dimensions, promote product optimization, and enhance user experience.

-
App feedback: the number of app feedback submitted by users on the app during the statistical period, indicating the problems encountered by users about app use. It shows the number of total and new feedback, pending feedback, distribution, and response time. Analyze user feedback issues in multiple dimensions, promote app optimization, and enhance user experience.
For example, the smart product operation team of a company received many app problems reported by users. The team checked the app version distribution chart and learned that most problems occurred in v2.1. Therefore, this result was sent to R&D personnel to solve the problems and update the app at the earliest opportunity.
Product feedback
Product feedback indicates the product use problems encountered by users. It shows the number of total and new feedback, pending feedback, distribution, and response time. Analyze user feedback issues in multiple dimensions, promote product optimization, and enhance user experience.

Terms
| Term | Description |
|---|---|
| Total product feedback | The number of product feedback submitted by users on the app. |
| Pending product feedback | The number of unprocessed feedback on products. |
| Today’s product feedback | The number of product feedback submitted by users on the app today. |
| Yesterday (yesterday’s product feedback) | The number of product feedback submitted by users on the app yesterday. |
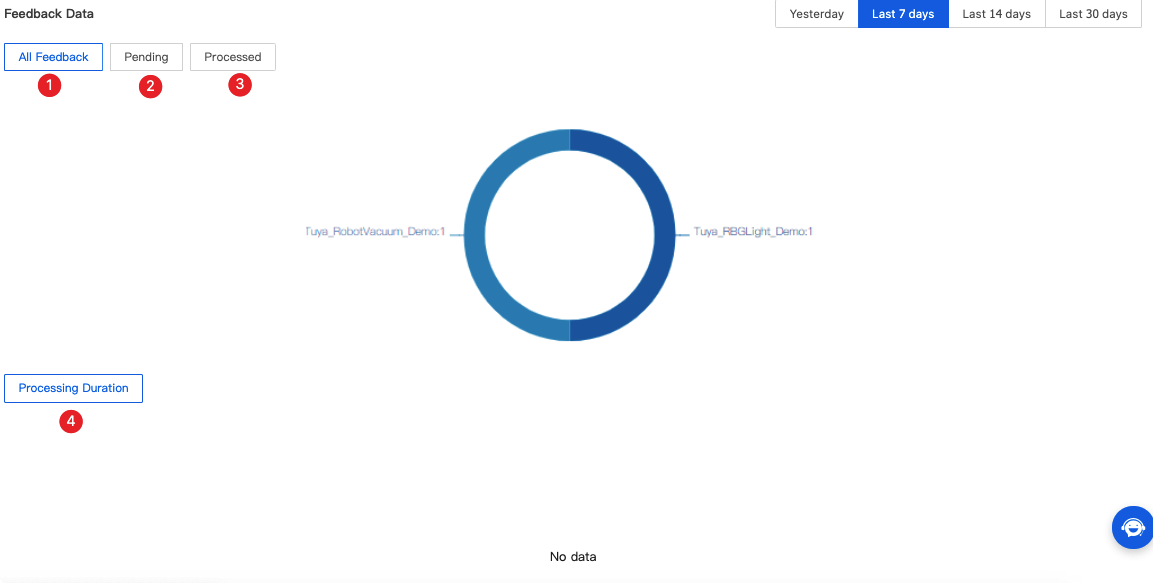
Feedback trend
-
All feedback: the number of feedback of different products in the product feedback category.
-
Not processed: the number of pending user feedback of different products in the product feedback category.
-
Processed: the number of processed user feedback of different products in the product feedback category.
-
Response time: the time of responding to the product feedback.

App feedback
App feedback indicates the app use problems encountered by users. It shows the number of total and new feedback, pending feedback, distribution, and response time. Analyze user feedback issues in multiple dimensions, promote app optimization, and enhance user experience.
For example, the smart product operation team of a company received many app problems reported by users. The team checked the app version distribution chart and learned that most problems occurred in v2.1. Therefore, this result was sent to R&D personnel to solve the problems and update the app at the earliest opportunity.

Terms
| Term | Description |
|---|---|
| Total app feedback | The number of app feedback submitted by users on the app. |
| Pending app feedback | The number of unprocessed feedback on the app. |
| Today’s app feedback | The number of app feedback submitted by users on the app today. |
| Yesterday (yesterday’s app feedback) | The number of app feedback submitted by users on the app yesterday. |
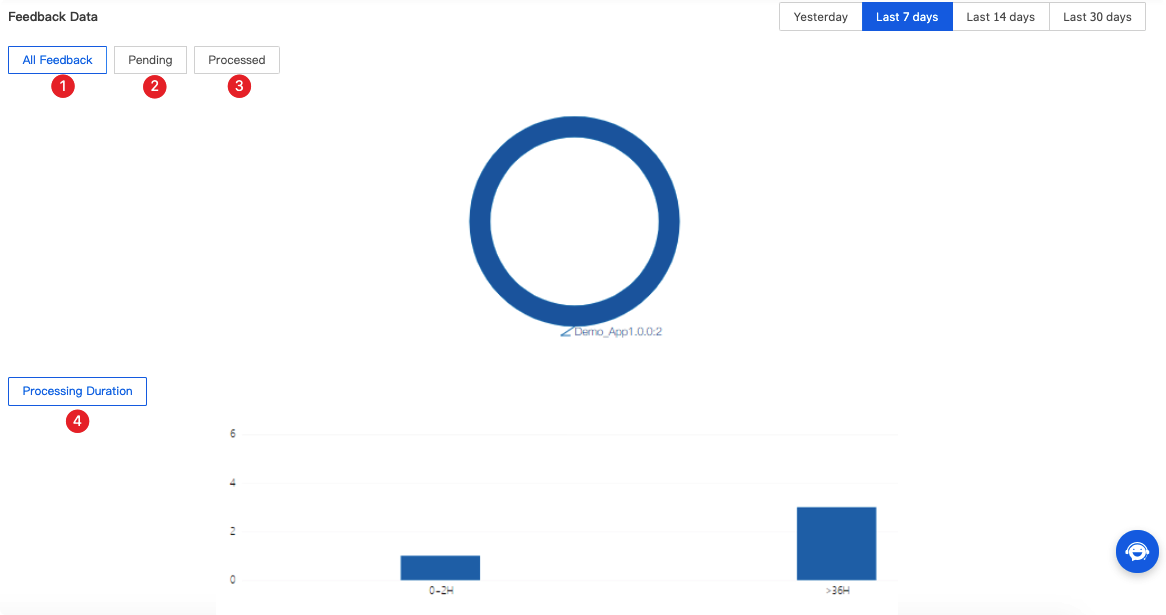
Feedback trend

-
All feedback: the number of feedback of different app versions in the app feedback category.
-
Not processed: the number of pending user feedback of different app versions in the app feedback category.
-
Processed: the number of processed user feedback of different app versions in the app feedback category.
-
Response time: the time of responding to the app feedback.
Is this page helpful?
YesFeedbackIs this page helpful?
YesFeedback


