Data Visualization
Last Updated on : 2024-06-20 06:18:02Copy for LLMView as MarkdownDownload PDF
The data visualization service provides customized development tools and visualized components, helping you display, analyze, and understand trends, outliers, and patterns in scenarios such as conferences, exhibitions, business monitoring, and risk alerts.
Features
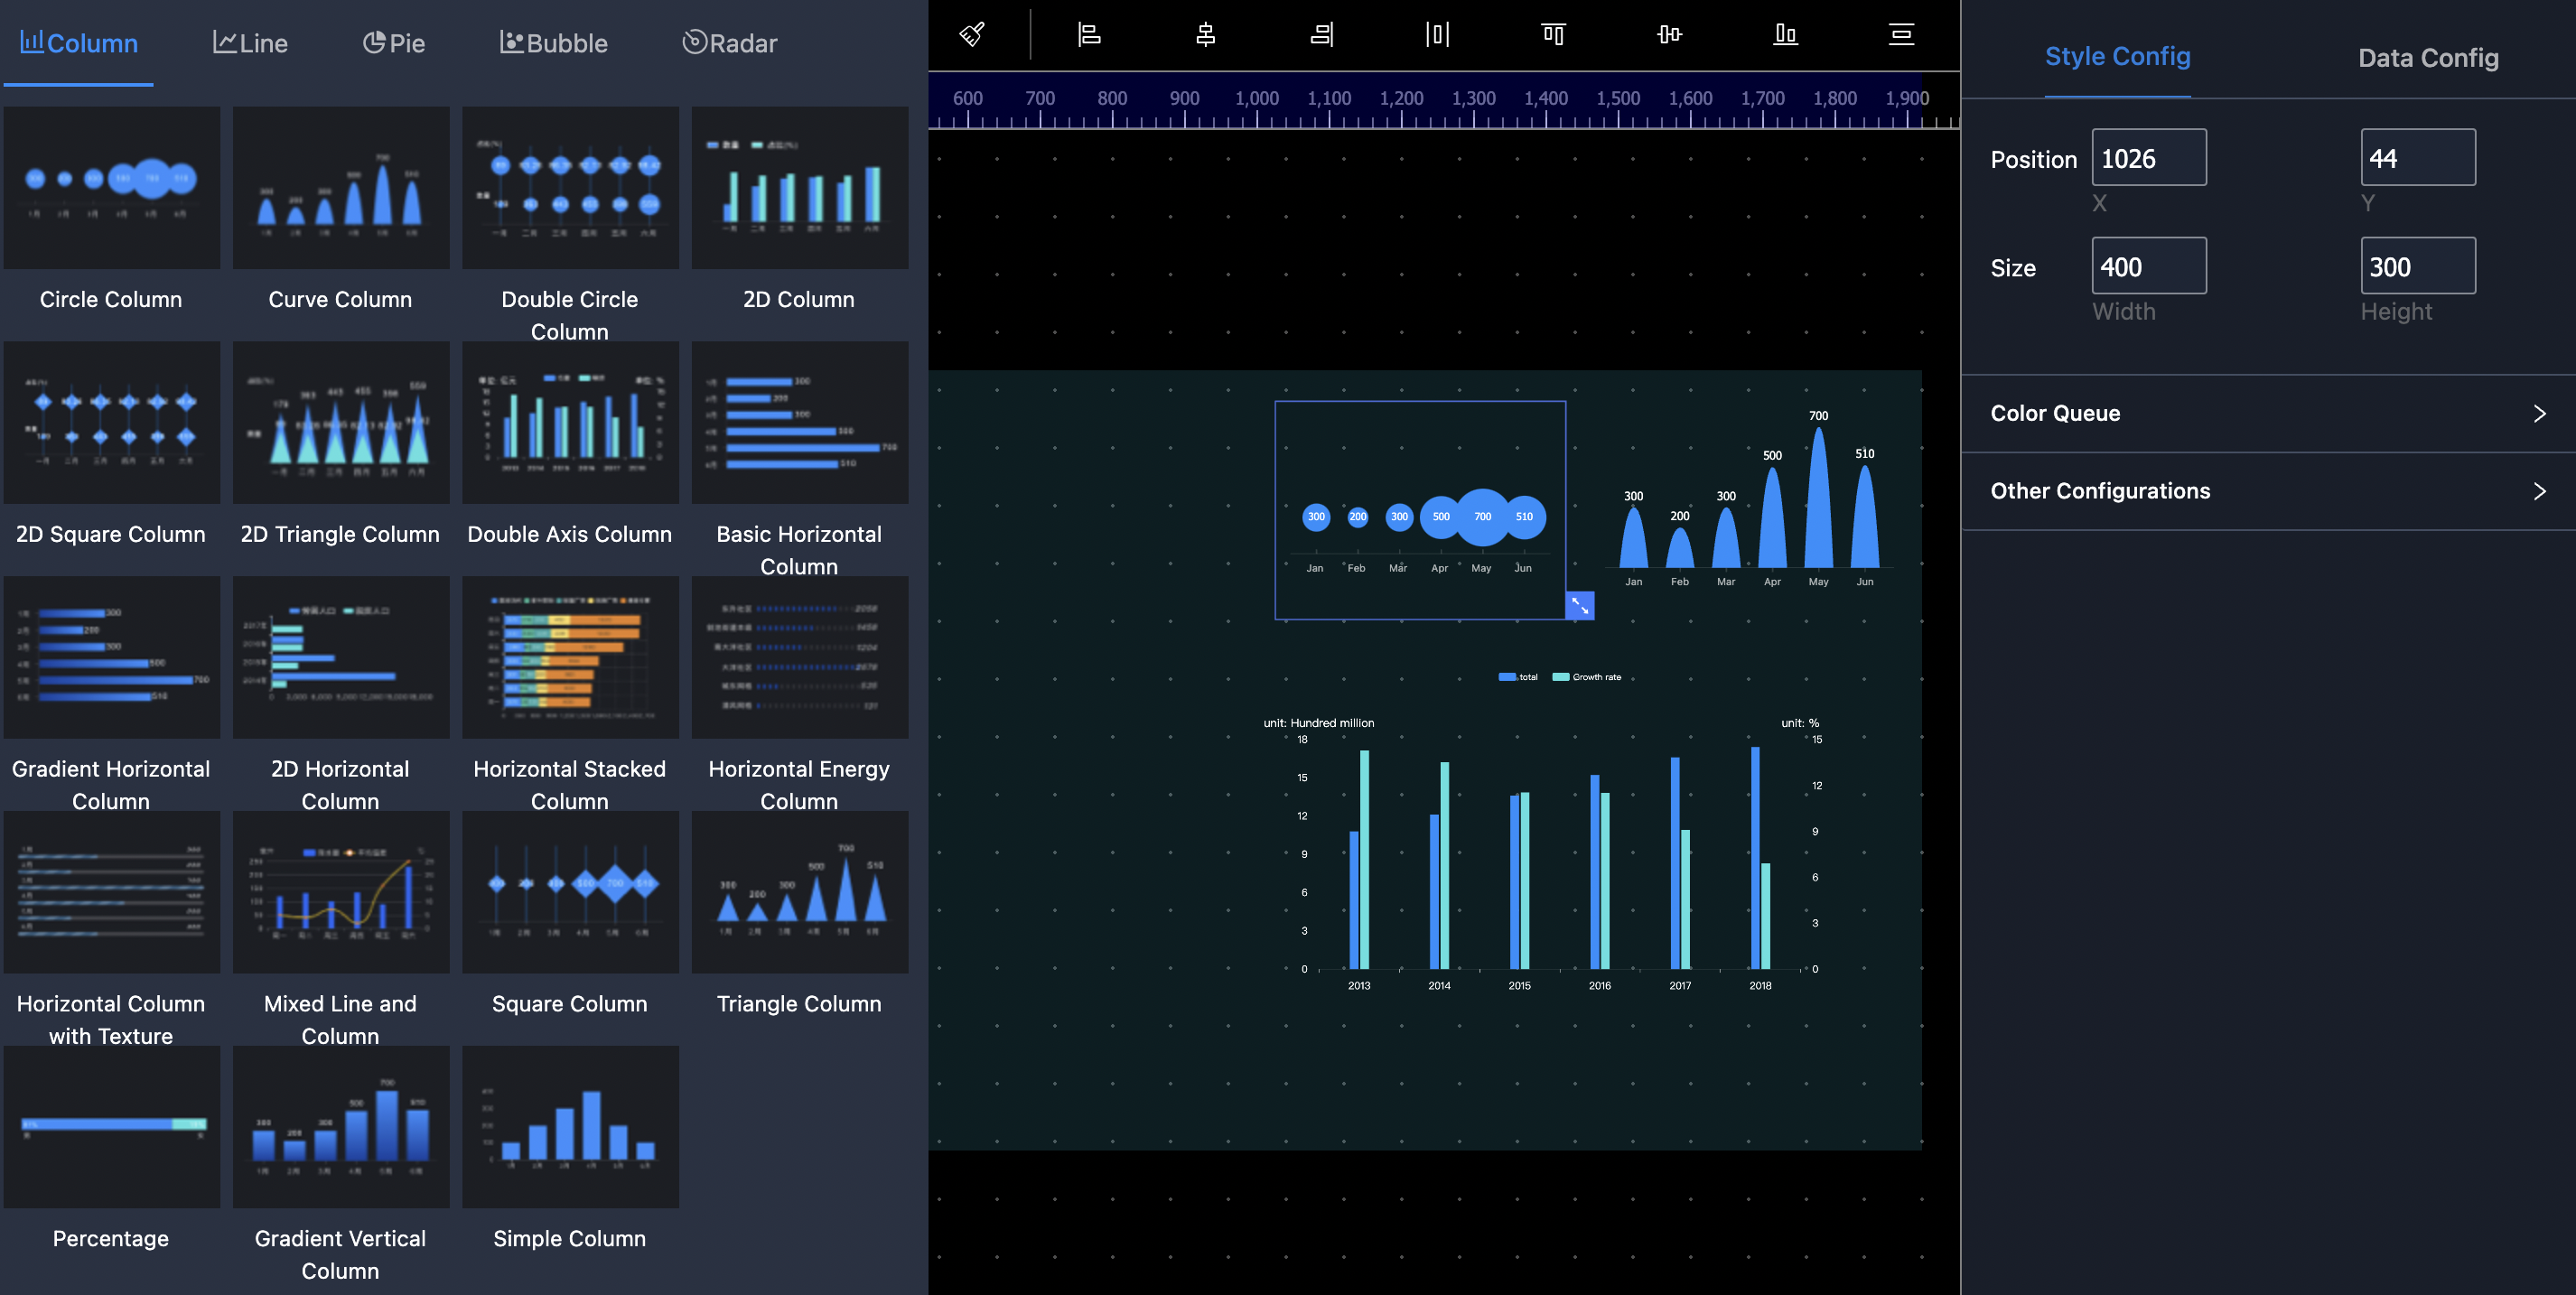
Abundant components
Provide feature-rich visual and industrial component library and integration with custom components.
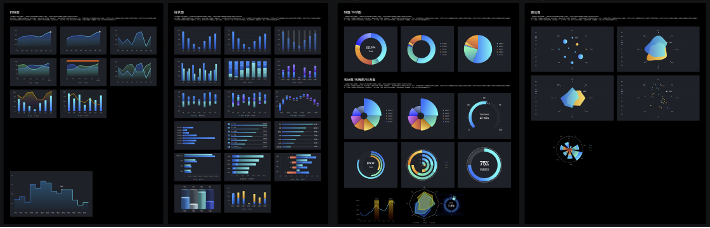
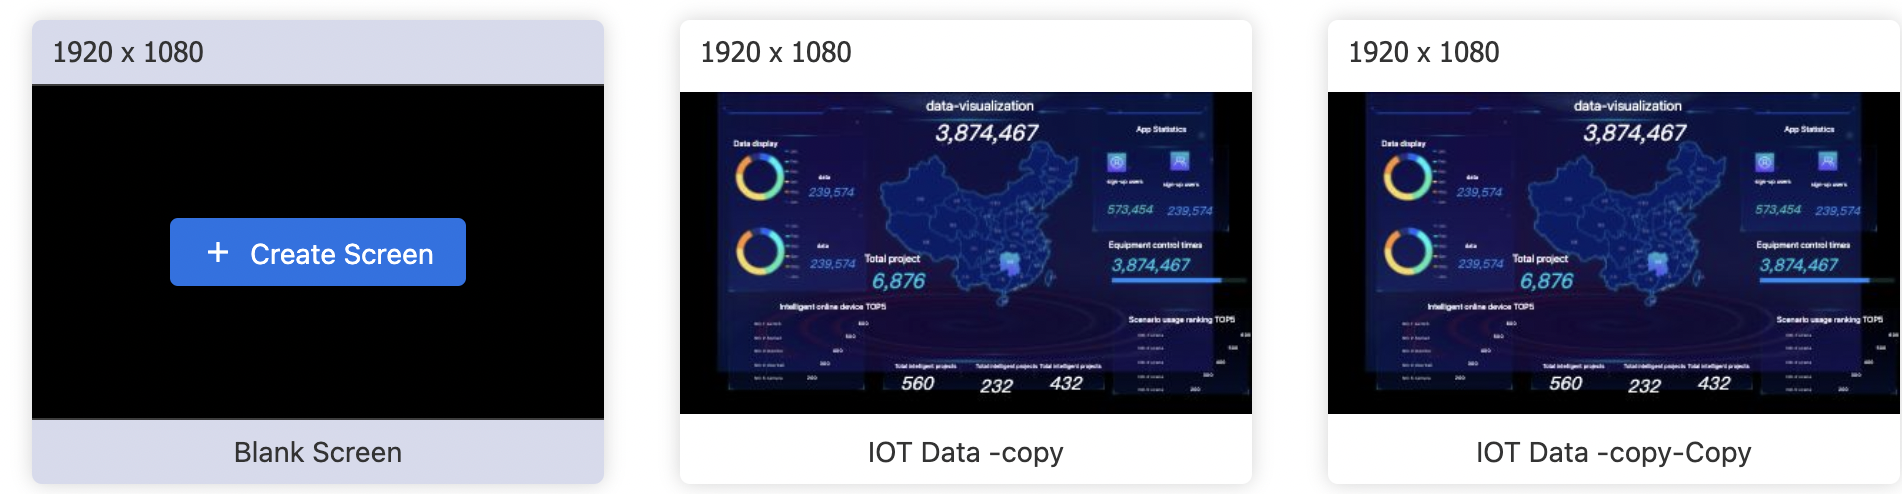
Out-of-the-box deployment
You can easily create an awesome visualization dashboard with a variety of built-in components and industry-specific templates.
Real-time data sources
Connect to Atop, Highway, JSON data, and RestAPI. Dynamic requests are supported.
Drag-and-drop
Just drag and drop to configure styles and data without programming.
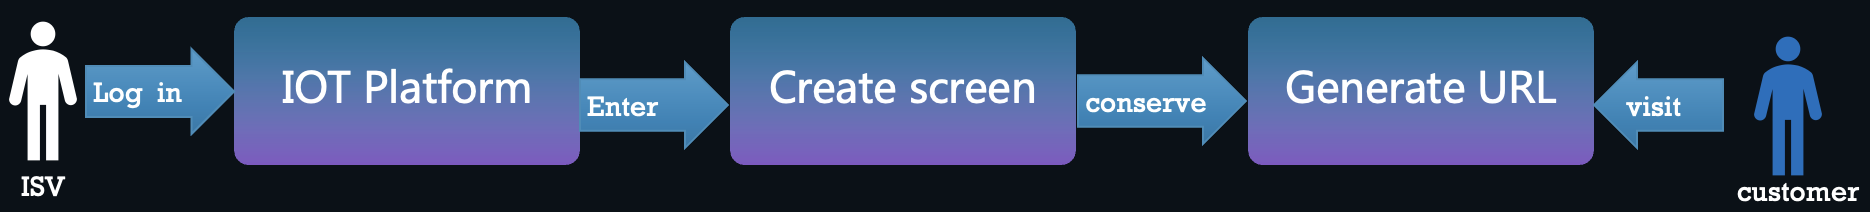
Product usage process
Is this page helpful?
YesFeedbackIs this page helpful?
YesFeedbackMarketing Cooperation
Business Cooperation
Customer Service
Media Inquiry