Data Overview
Overview
The following comprehensive statistics sections are included: the total real-time overview, today’s real-time overview, overall dashboard, product distribution, and category linkage analytics. The Data Overview section provides a visualized glimpse of the overall metrics for your smart products, OEM apps, and product usage.
Total real-time overview
-
Total activated devices: A device is activated when it is bound with the app through pairing for the first time. The number of total activated devices is the total number of the activated devices that match the PIDs under the current account.
-
Total registered users: the total number of registered users linked with the app under the current account.
-
Total faults: the total number of faults reported by devices under the current account.
-
Total user feedback: the total number of feedback messages submitted by users on the app that is linked with the current account.
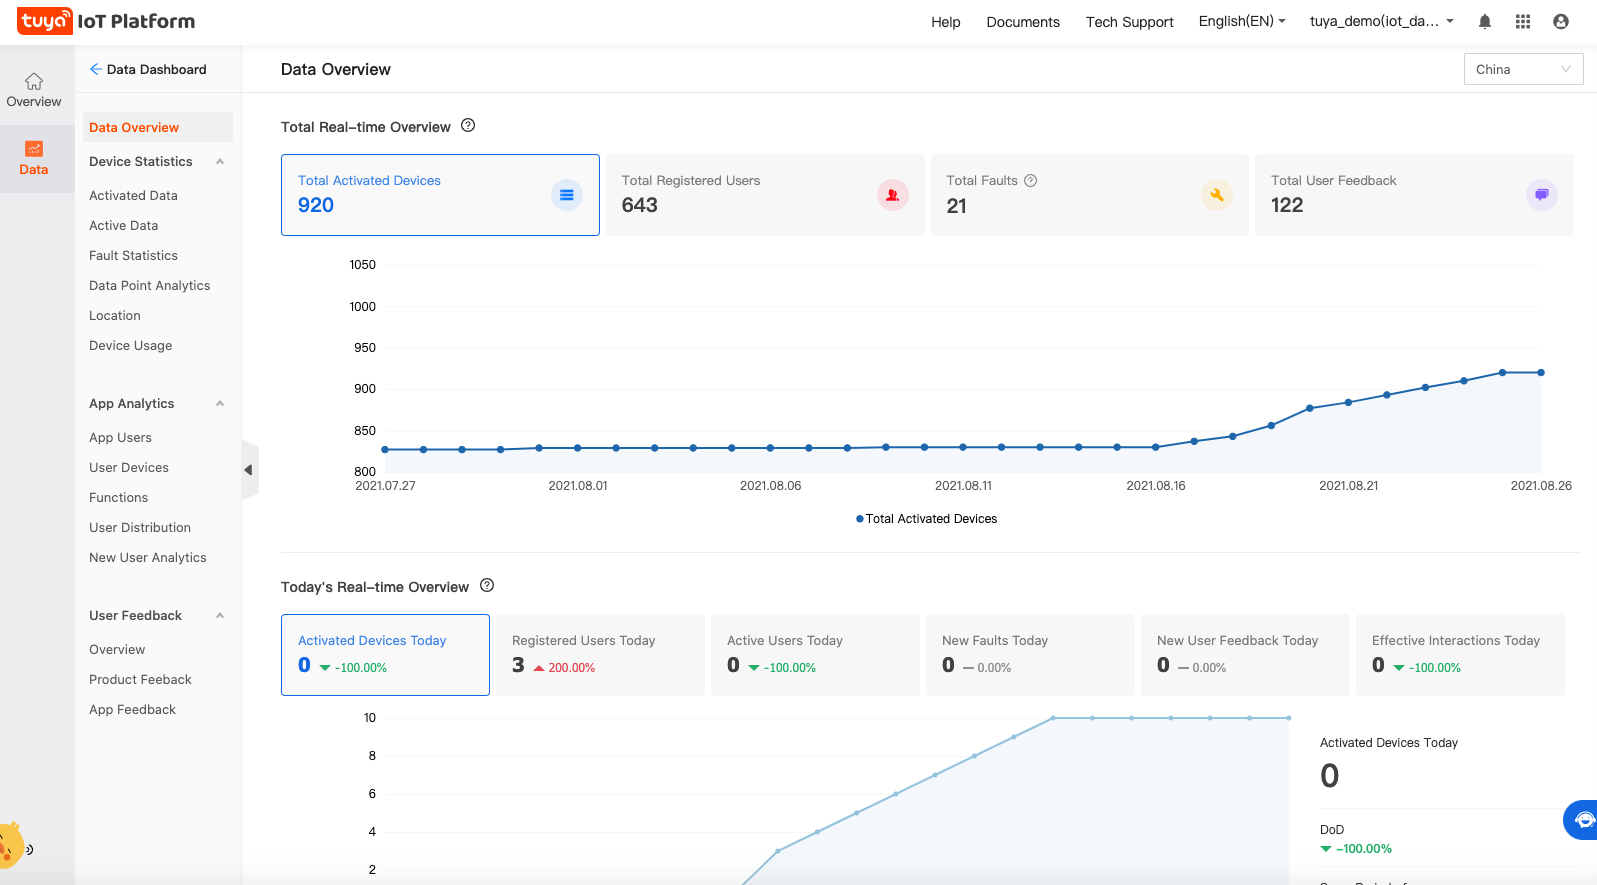
Today’s real-time overview
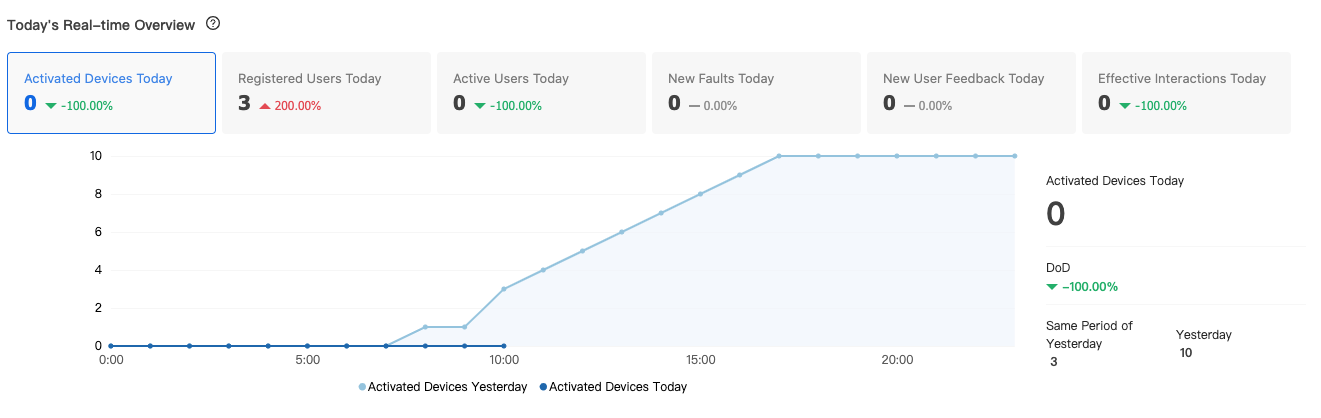
- Activated devices today: the number of devices that are bound with the app through pairing for the first time under the current account today.
- Registered users today: the number of today’s newly registered users of the app under the current account.
- Active users today: the (deduplicated) number of users who have logged in to the app today.
- New faults today: the total number of faults that are reported by the devices through the fault data point under the current account. One device can report multiple faults.
- New user feedback today: the total number of feedback messages submitted by users on the app today.
- Effective interactions today: the number of interactions that are reported by the devices through the data point under the current account today. One device can report multiple interactions.
- DoD: today’s (as of now) data ÷ yesterday’s data in the same period -1
- Same period of yesterday: the data of this indicator at the same period of yesterday.
- Yesterday: yesterday’s data of this indicator.
Overall Dashboard
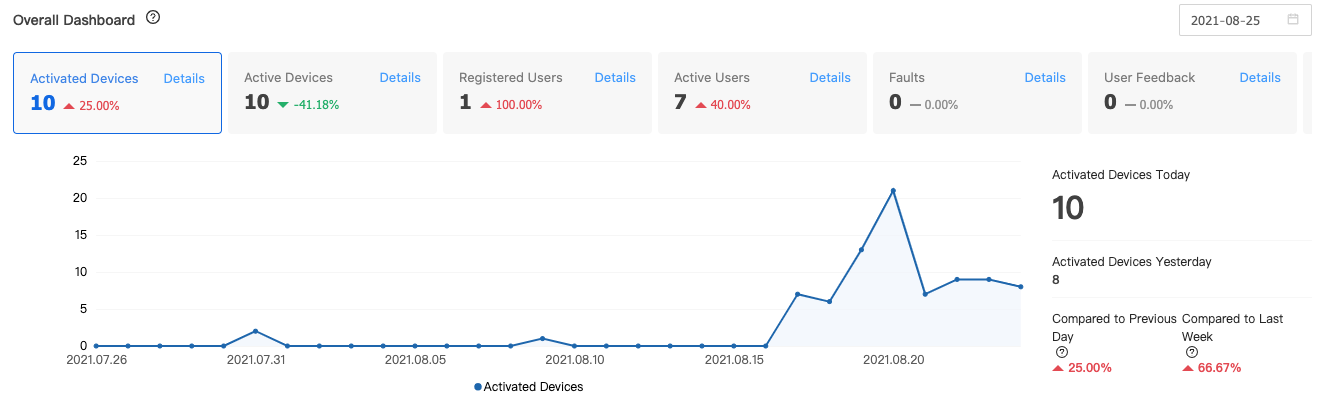
- Activated devices: the number of devices that are bound with the app through pairing for the first time under the current account during the statistical period.
- Active devices: the number of online devices under the current account during the statistical period.
- Registered users: the number of newly registered users of the app under the current account during the statistical period.
- Active users: the (deduplicated) number of users who have logged in to the app today.
- Faults: the number of faults that are reported by the devices through the fault data point under the current account during the statistical period. One device can report multiple faults.
- User feedback: the total number of feedback messages submitted by users on the app during the statistical period.
- Activated devices yesterday: the number of activated devices on the day before the statistics.
- Compared to previous day: the data on the statistical day ÷ the data on the day before the statistical day - 1.
- Compared to last week: the data on the statistical day ÷ the data of the last 7 days before the statistical day - 1.
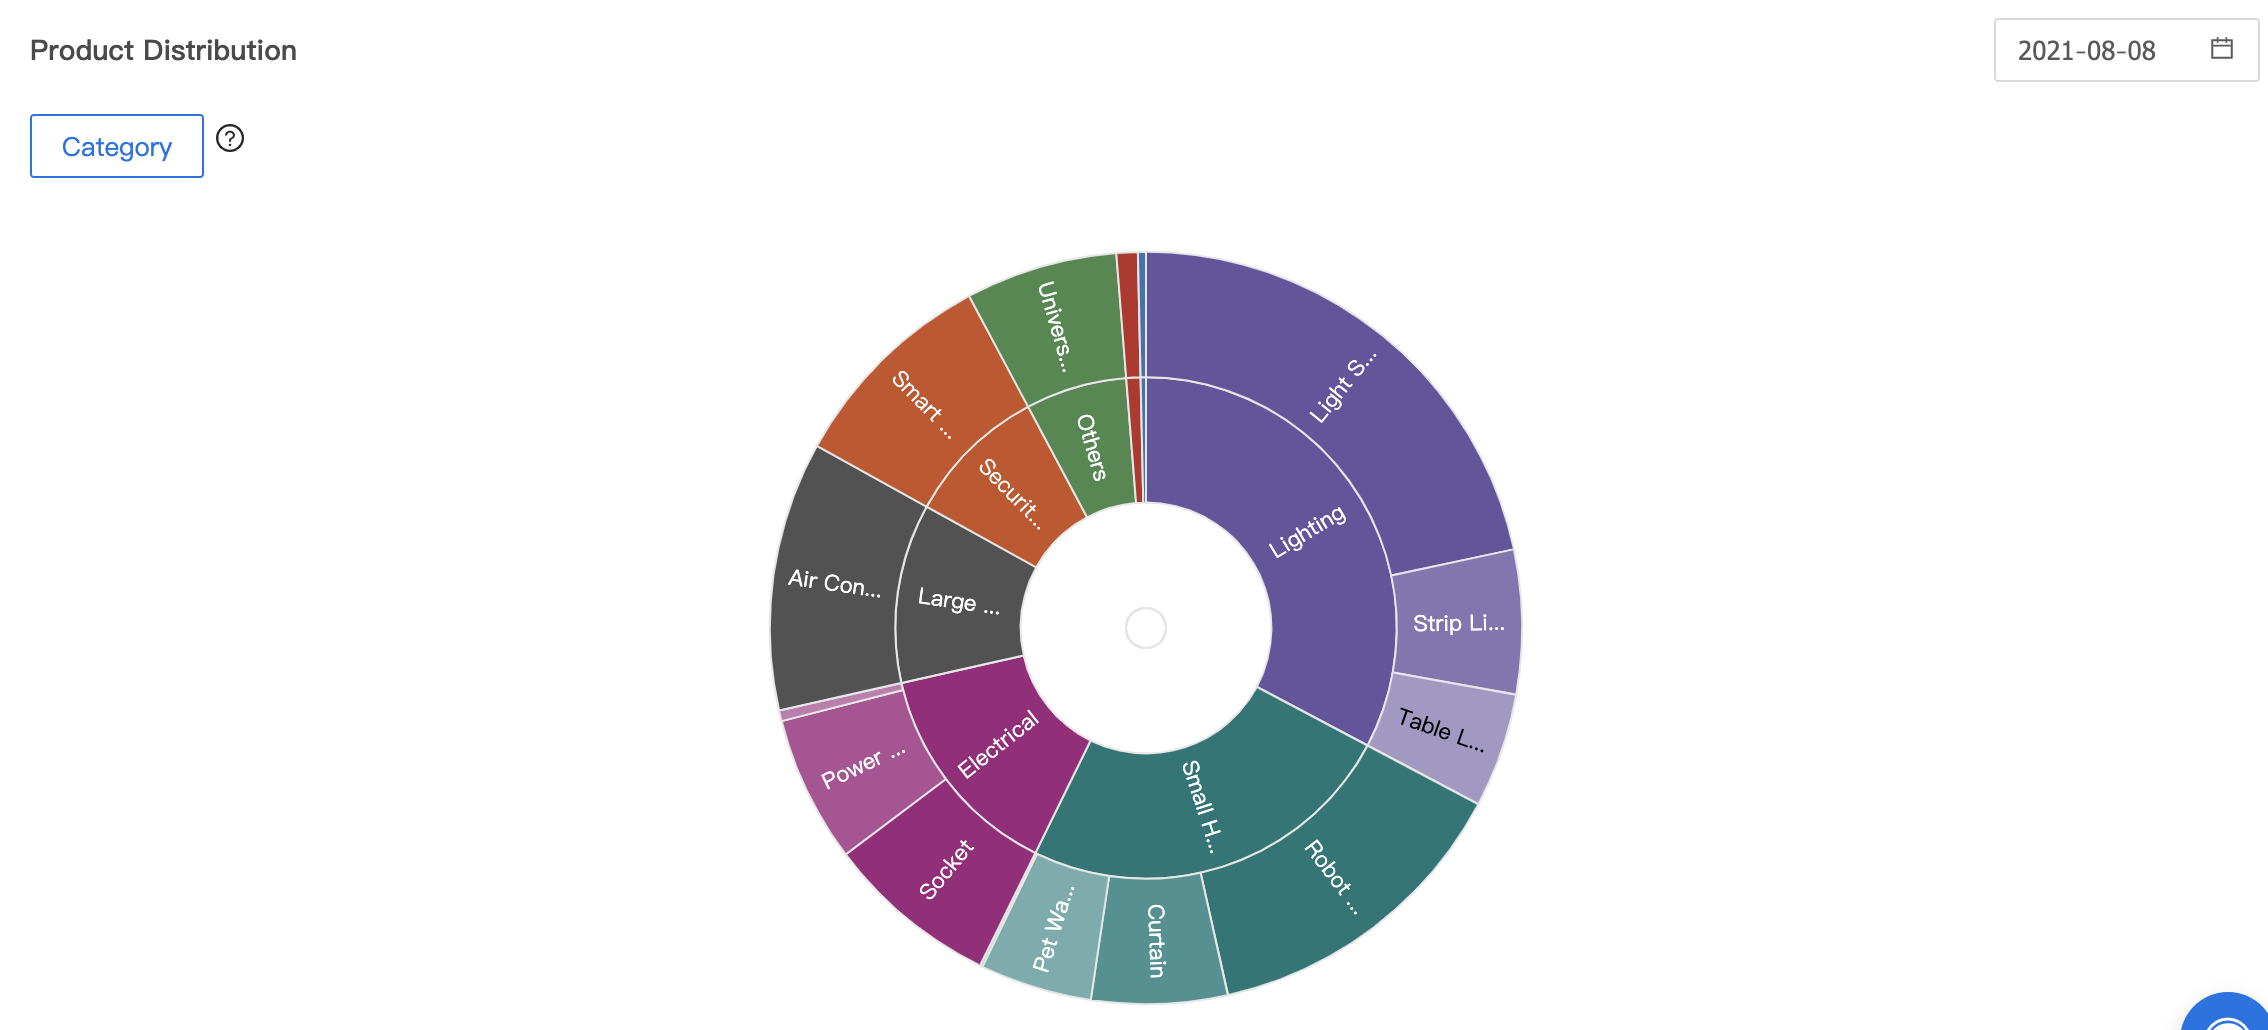
Product distribution
-
Category: By using a sunburst chart, visualize data structures of the first and secondary product categories bound with all apps under the account as of the statistical day.
-
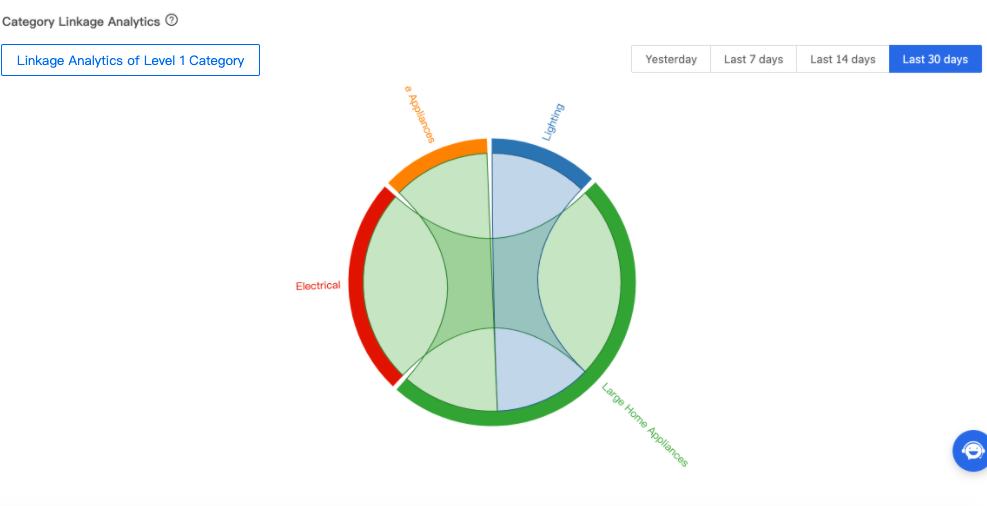
Category linkage analytics: Linkage means that multiple devices in one scenario are triggered at the same time within a statistical cycle. In this case, the system calculates the number of linkages with devices of the first category on all apps under the account. For example, the linkages with lighting and electrical products. You can analyze the customer behavior by looking into the interaction data with a chord diagram. You can filter the category linkage trends of yesterday, the last 7 days, the last 14 days, and the last 30 days.
Is this page helpful?
YesFeedbackIs this page helpful?
YesFeedback