Module Debugging Assistant
Tuya Module Debugging Assistant is an all-in-one debugger using serial communication. It can simulate both the network modules and microcontrollers and support a bunch of protocols such as Wi-Fi, Bluetooth, and Zigbee to help you perform a comprehensive test on your embedded system.
Requirements
- The software is built on top of Windows Presentation Foundation (WPF).
- Install .NET Framework 4.6.1 depending on your OS.
- Windows XP is not supported.
- Install .NET Framework 4.6.1 on Windows 7 or later, or earlier than Windows 10 version 1511.
- .NET Framework is not required for Windows 10 version 1511 or later.
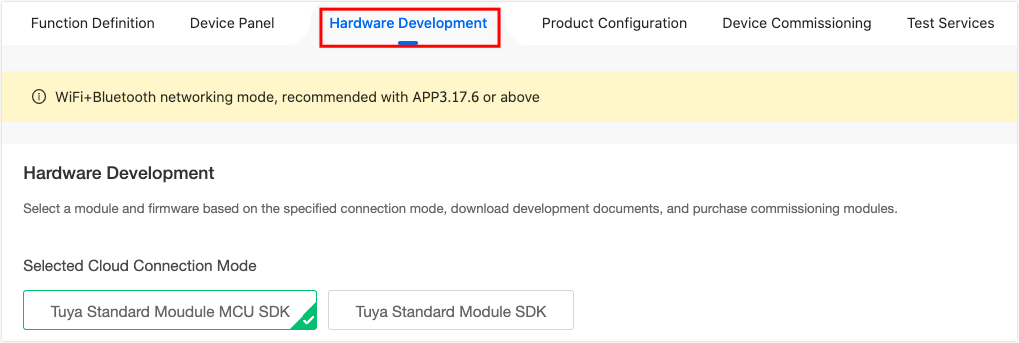
Download software
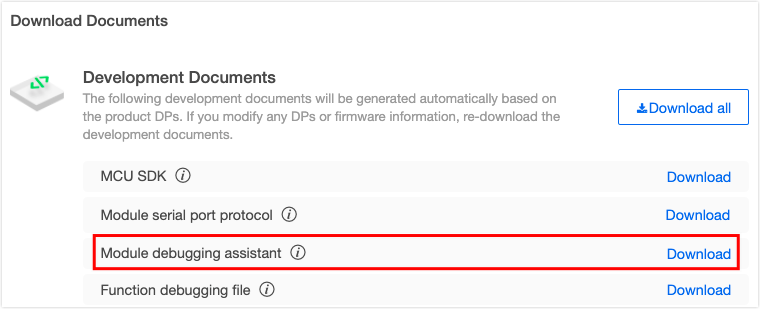
The debugging assistant works with a JSON configuration file generated based on your defined product functions.
Therefore, you must create a product using the Custom Solution on the Tuya Developer Platform. In the third step of Hardware Development, find Download Documents, and download the debugging assistant. For more information, see Create Products.
Layout
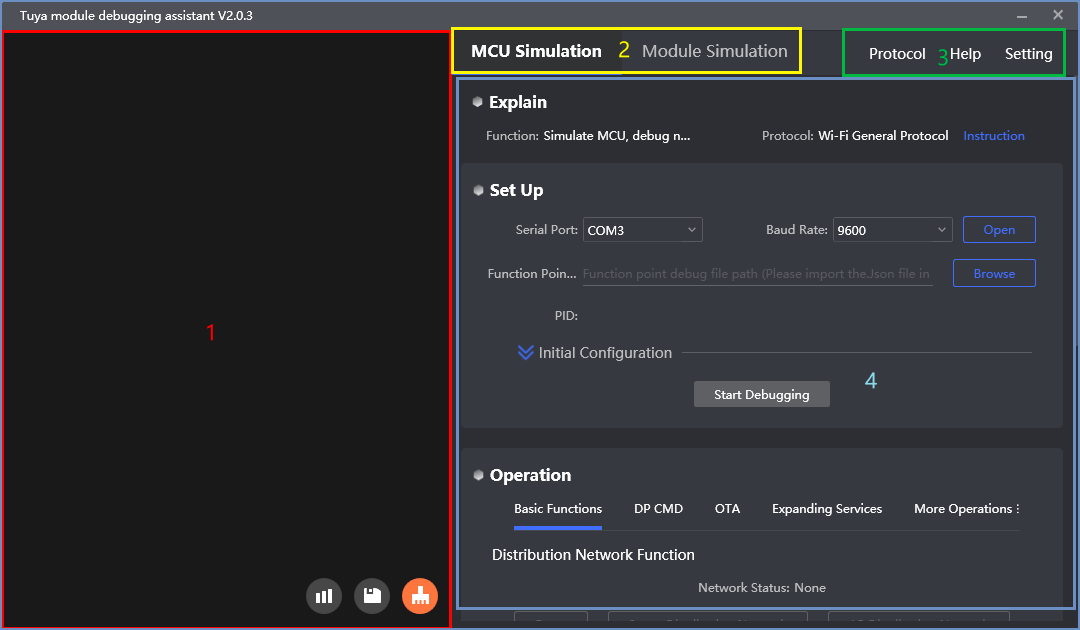
The debugging assistant is composed of the following areas:
-
The left area is used for serial port data display, including receiving and transmitting frame information and key data analytics. The three buttons below are used to display, save, and clear the displayed data.
-
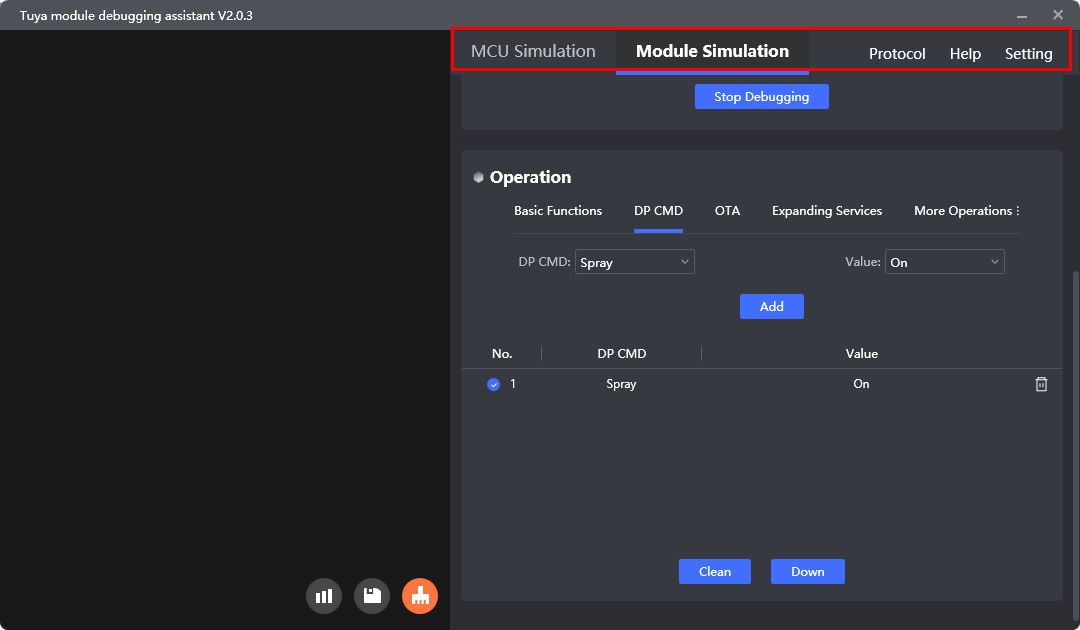
In the mode selection area, you can switch to the assistant mode. The assistant has two modes:
MCU SimulationandModule Simulation, which can be used as the MCU and module respectively. -
General function configuration items. Protocol can be selected as needed, Help is an auxiliary function, and Setting refers to page display and data interaction parameter settings.
-
The functional operation area contains three parts: Explain, Set Up, and Operation. It shows the selected protocol, instruction link, and configuration items when you start debugging. Debugging functions differ depending on configuration items. The Operation area is for specific function testing.
Features
The Module Debugging Assistant is essentially a serial port assistant that integrates the communication protocols of Tuya modules. You can choose the corresponding protocol according to your actual needs. The assistant has two working modes.
-
MCU simulation mode
The assistant simulates the MCU, and the computer connects to the serial port of a Tuya module through a serial port tool. After the module is powered on, it initiates initialization data interaction, and the assistant simulates the MCU to automatically respond with the correct data. In this mode, you can use the Tuya app to pair the module and check the correct data reporting and sending format. After you get the module, you can use this mode to test data interaction, which greatly improves development efficiency. If you encounter problems during the debugging process, this mode helps to locate the problem.
-
Module simulation mode
The assistant simulates the Tuya module, and the computer connects to the MCU serial port through a serial port tool. The assistant automatically initiates the initialization data interaction and checks whether the MCU responds with the correct data. This mode is usually used to test whether the MCU protocol code is correct after the code is migrated. The assistant will give a prompt for the wrong data. Be sure to pass this mode verification before connecting to the actual module, which can reduce the probability of later problems.
The module simulation mode only verifies the communication between the MCU and the module and does not provide real networking capability. After finishing the test, you can connect the MCU to the actual module and test pairing functionality and specific features.
Procedure
This section describes how to use the step-by-step guide on how to use the debugger.
MCU simulation mode
The assistant simulates the actual MCU. When it is connected to the Tuya module, you can perform the network pairing test. In the early stage of development, you can understand the correct data interaction format to improve development efficiency. In the process of development and joint debugging, you can also use this mode to locate problems.
-
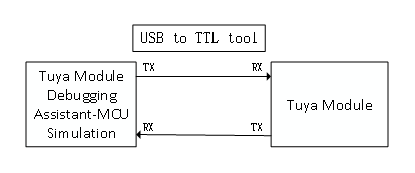
Connect the hardware.
Use the USB-to-TTL converter to connect the Wi-Fi module serial port to the computer serial port.
-
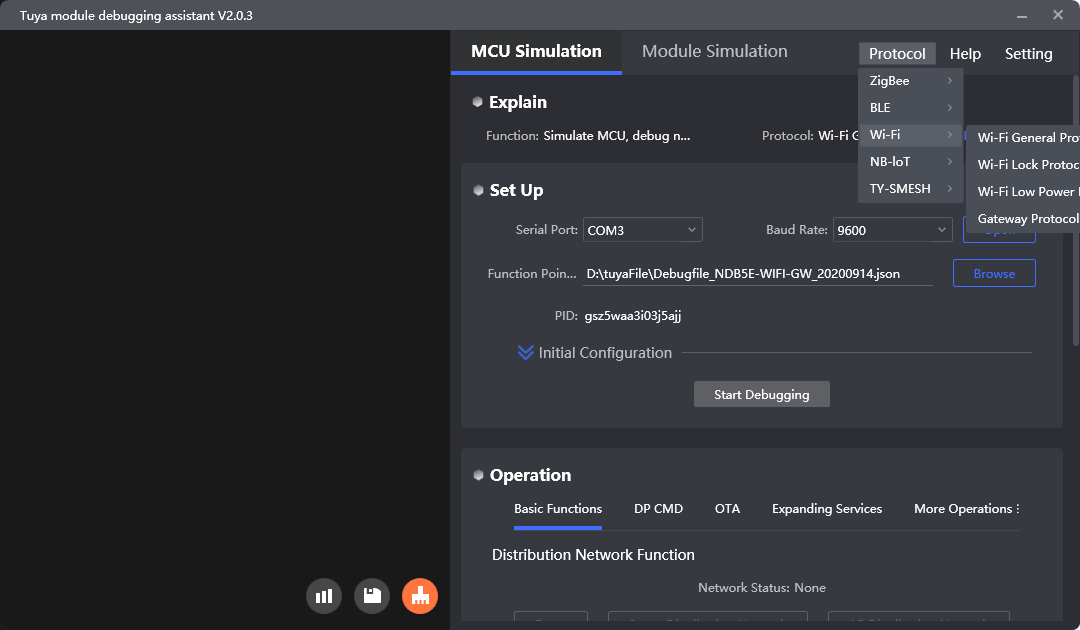
Select the communication protocol.
Take the Wi-Fi general protocol as an example. Click Protocol > Wi-Fi > Wi-Fi General Protocol, and click MCU Simulation to enter the homepage of the simulation debugging assistant of the Wi-Fi module.
-
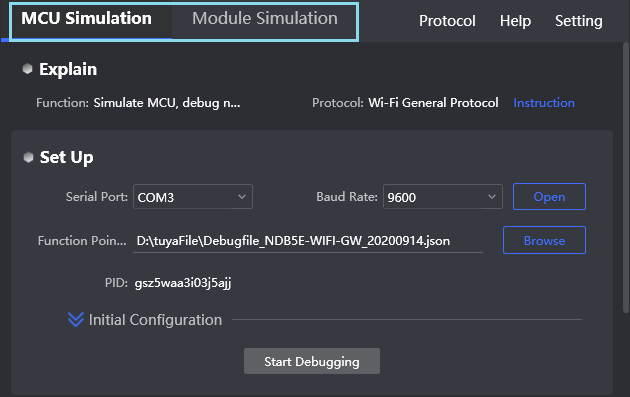
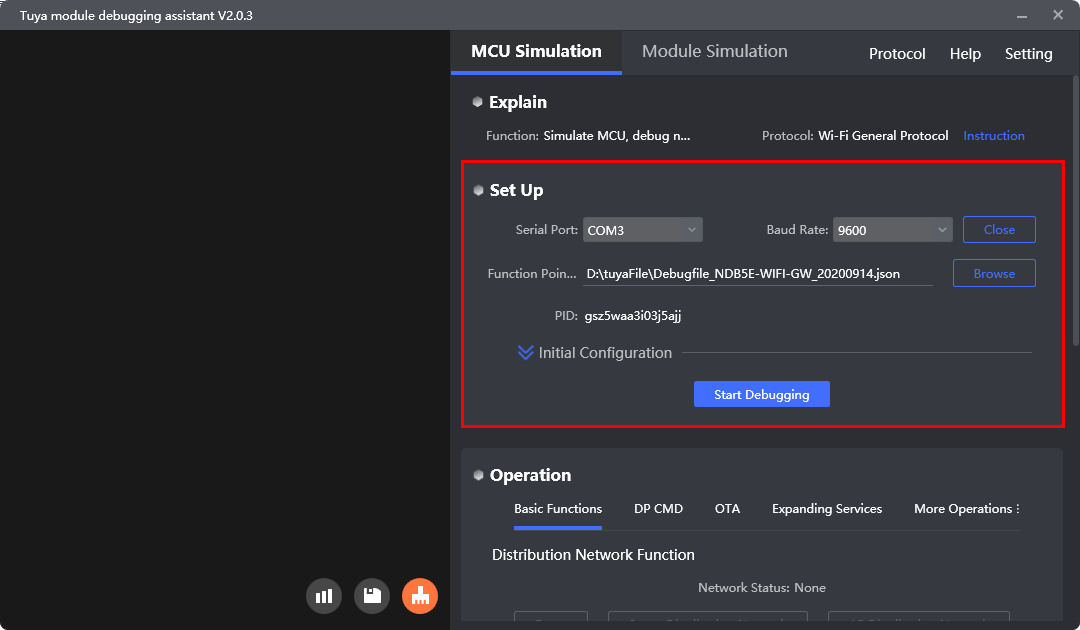
Configure startup options.
-
Select the correct serial port and baud rate, and click Open.
-
Click Browse to import the debugging file.
When creating a custom solution on the Tuya Developer Platform, you can download it in the Download Documents area on the Hardware Development tab.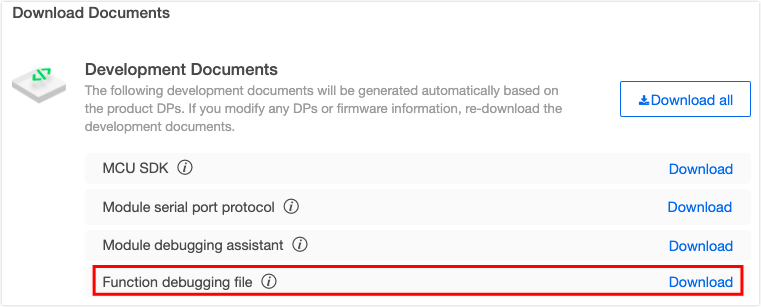
-
Click Start Debugging, and the assistant starts working. The Initial Configuration section shows the parameters that are configured during initialization. You can modify them or keep them as they are.
-
-
Network pairing test.
-
After the debugging starts, the host receives the heartbeat and initialization data from the module.
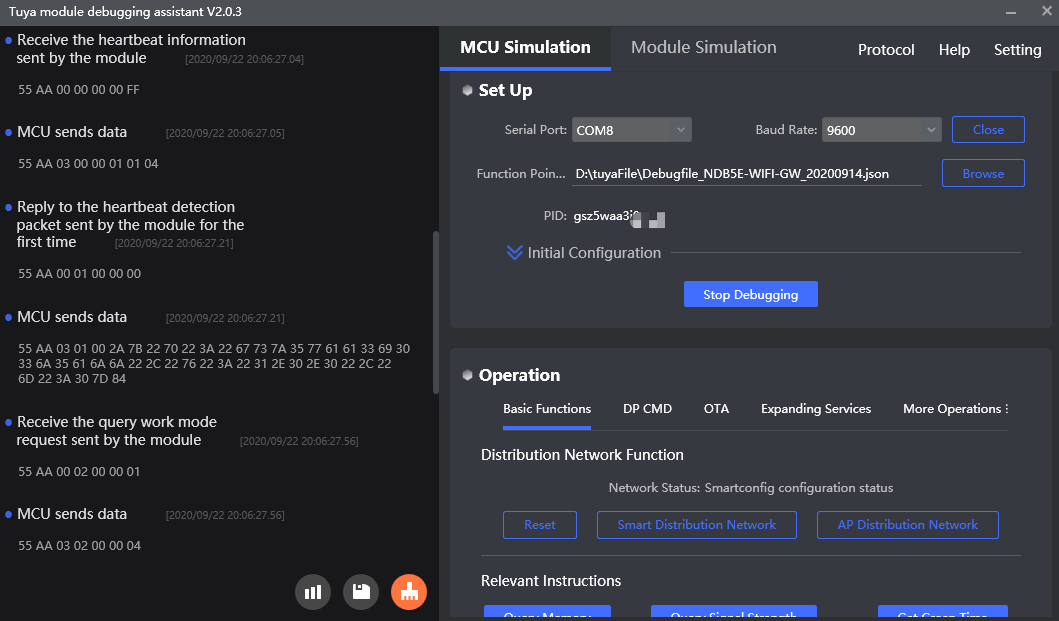
If the host receives no data, check the hardware connection, power supply, and TX and RX connection, and then power on the module again.
-
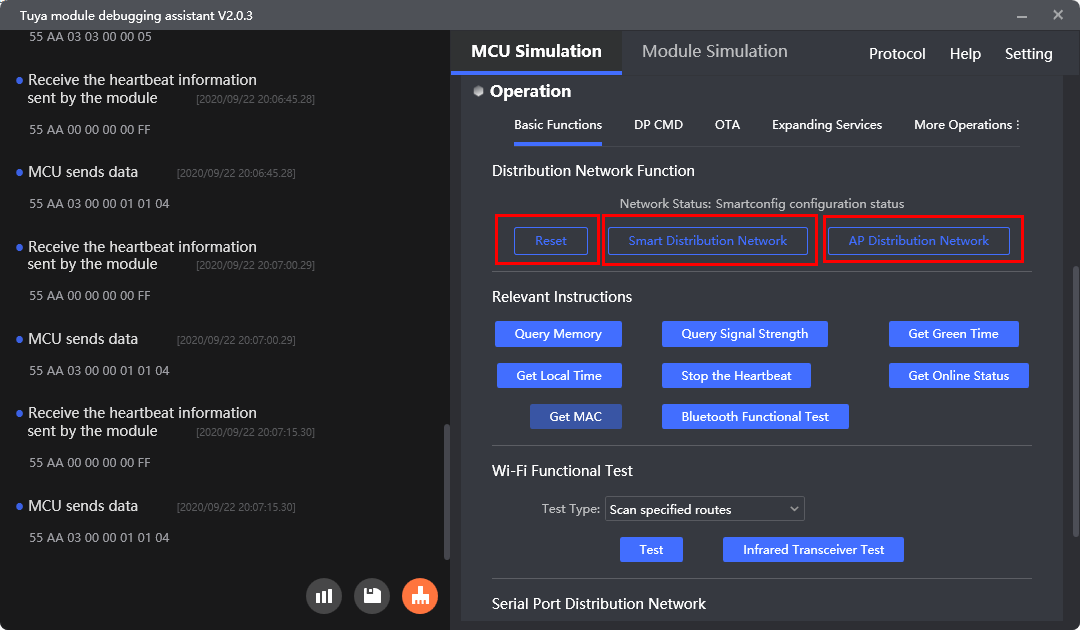
Click Reset and select Smart Distribution Network or AP Distribution Network to let the module enter pairing mode.
-
Open the Tuya app to pair with the module.
-
SmartConfig pairing: Pair devices by broadcast in a one-to-many approach. It is ease of use. However, when the network environment is complicated or the router does not support SmartConfig, the pairing might not succeed.
a. Enter the app and tap the "+" symbol in the top right corner to add a device.
b. Select a small home appliance. Take the aroma diffuser as an example.
c. Tap Confirm the indicator is blinking rapidly.
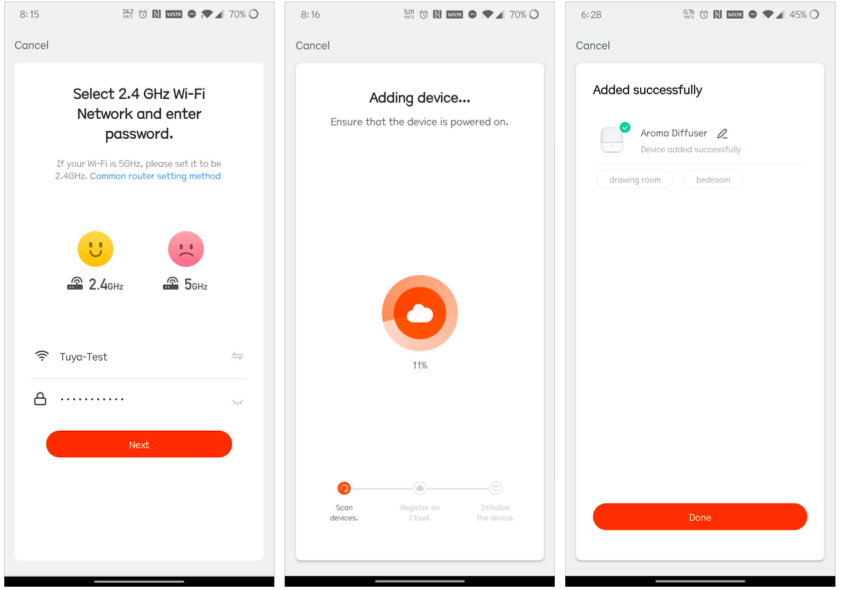
d. Enter the Wi-Fi password.
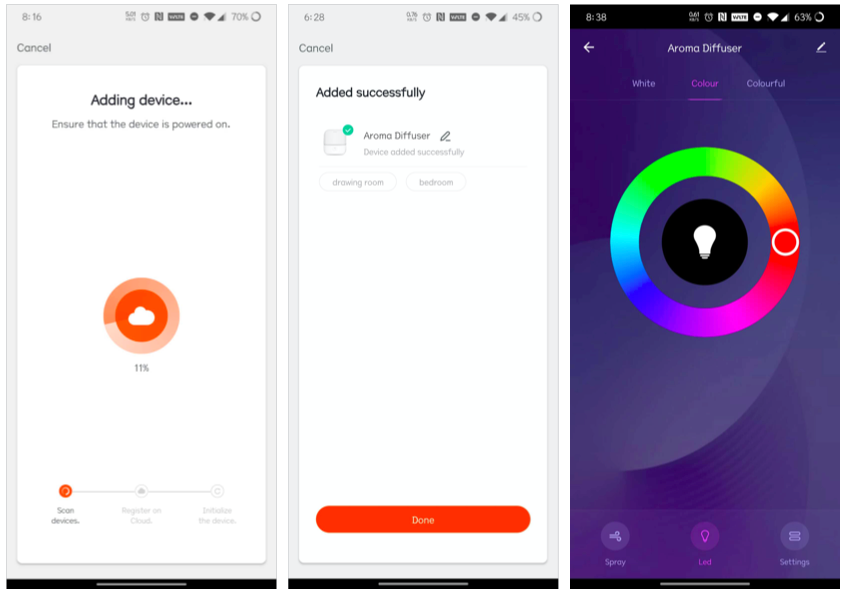
e. Wait for a while to successfully pair the network.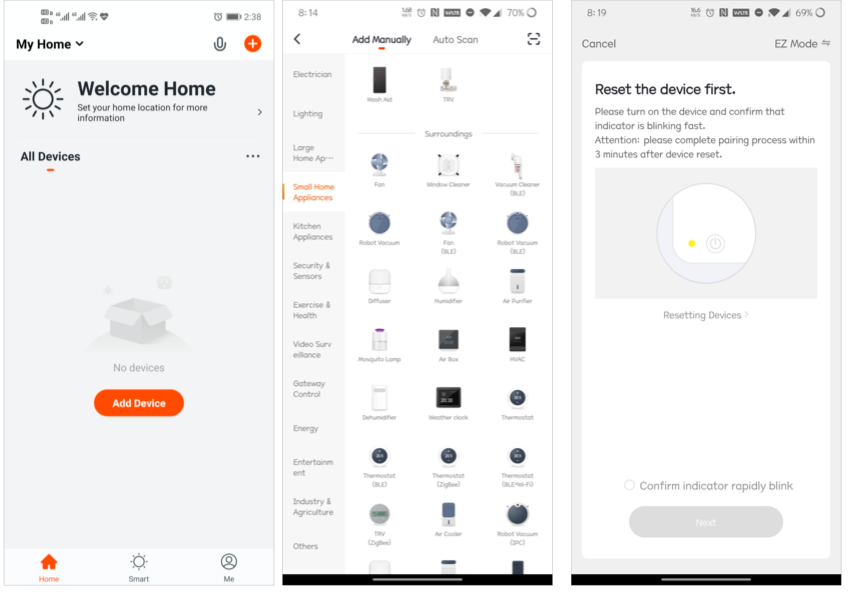
-
AP pairing: Pair the device in a one-to-one approach. It is stable and reliable. The operation of AP mode on the mobile phone is as follows:
a. Enter the app and tap the "+" symbol in the top right corner to add a device.
b. Select a small home appliance. Take the aroma diffuser as an example.
c. Tap Confirm the indicator is blinking rapidly.
d. Tap EZ Mode in the top right corner to select AP Mode.
e. Tap Confirm the indicator is blinking slowly.
f. Enter the Wi-Fi password.
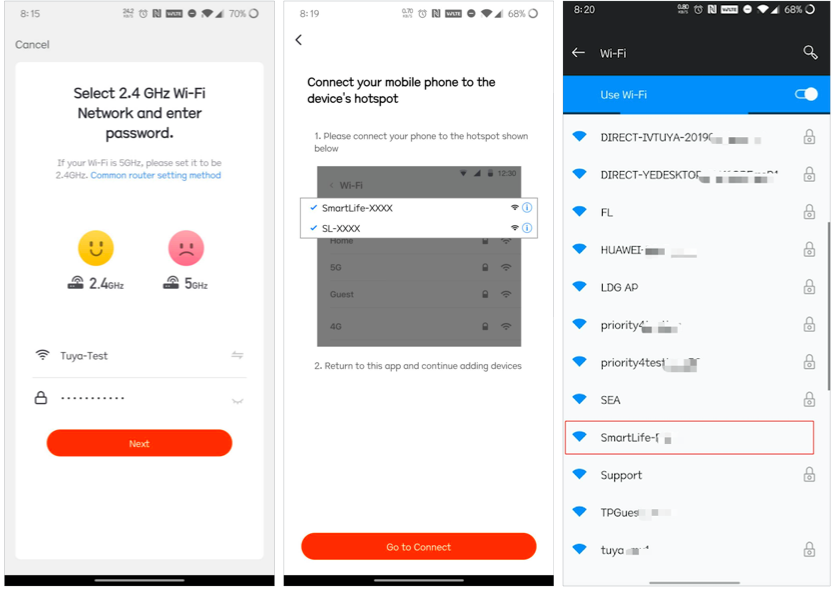
g. Connect the mobile phone to the hotspot generated by the device.
h. Wait for a while to successfully pair the network.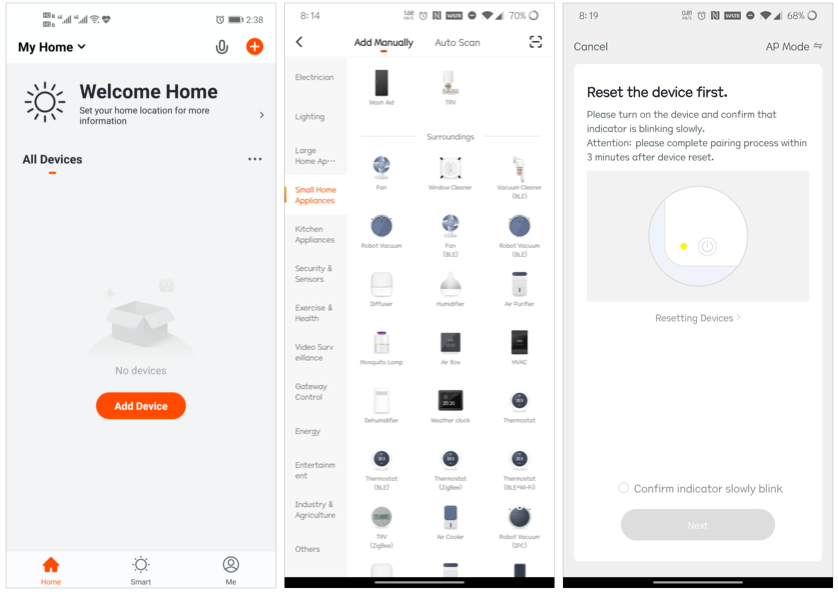
-
- The pairing mode of the Wi-Fi module must be consistent with that of the app. If they are inconsistent, you shall switch to the correct pairing mode.
- Your mobile phone must be connected to the 2.4 GHz Wi-Fi. Currently, Wi-Fi devices equipped with Tuya modules only support the 2.4 GHz band.
- Make sure that the password entered is correct.
- Keep the distance between the router, mobile phone, and device as short as possible.
-
-
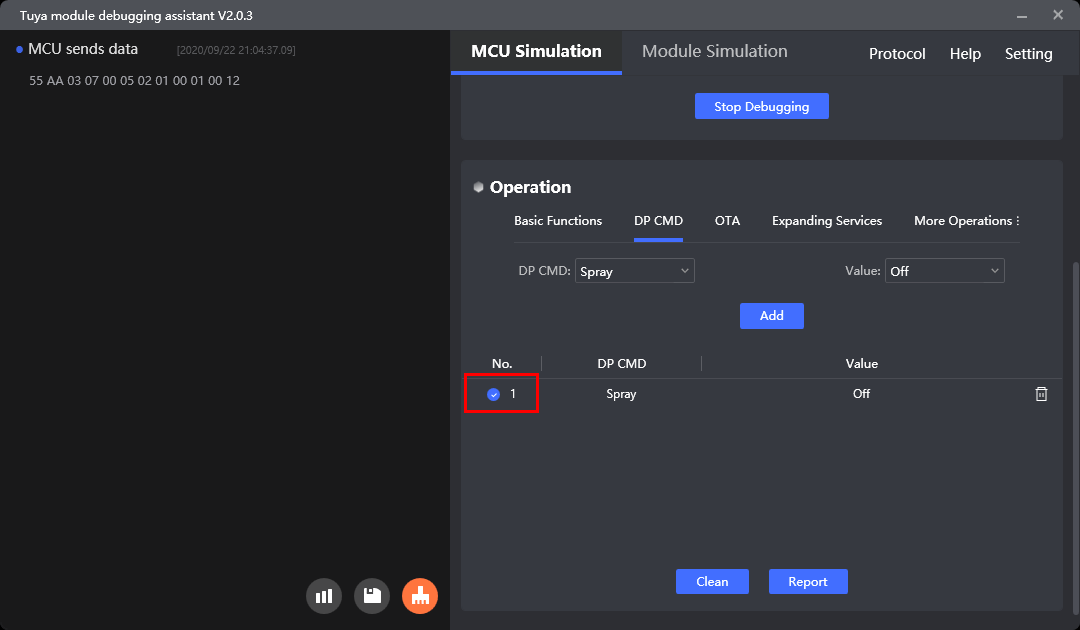
Test DP reporting.
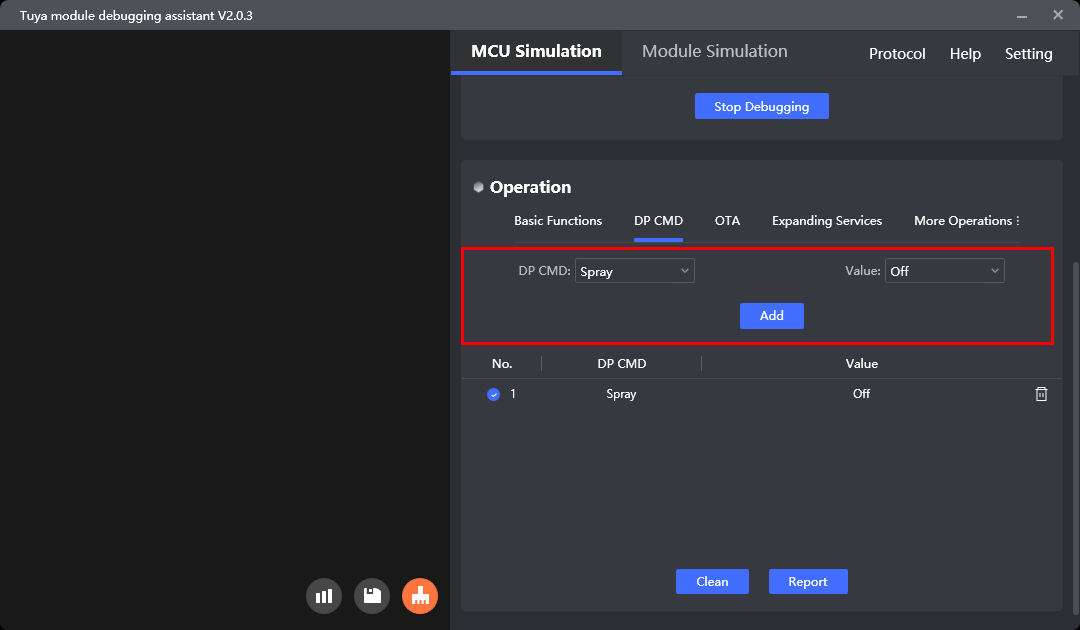
After the pairing is completed, you can select the DP on the DP CMD tab to actively report. The app panel will change when the corresponding data is received. This function can be used to test the panel display and view the correct DP reporting data format. It is one of the most commonly used functions.
Click the reporting tab to enter the reporting test page.
-
Select a DP command: Options in the drop-down list show the
namefield in the imported DP debugging file. -
Enter
Value: It is the selectable or writable value of the DP command. -
Click Add. The selected DP command and value will be added to the list box on the right.
-
(Optional) Click Clean to clear the selected items in the right list box.
-
Click Report. The DP data will be reported according to the settings. As shown in the figure below, the report switch is Off. You can see the corresponding reported data is displayed on the left, and the app is shut down.
-
-
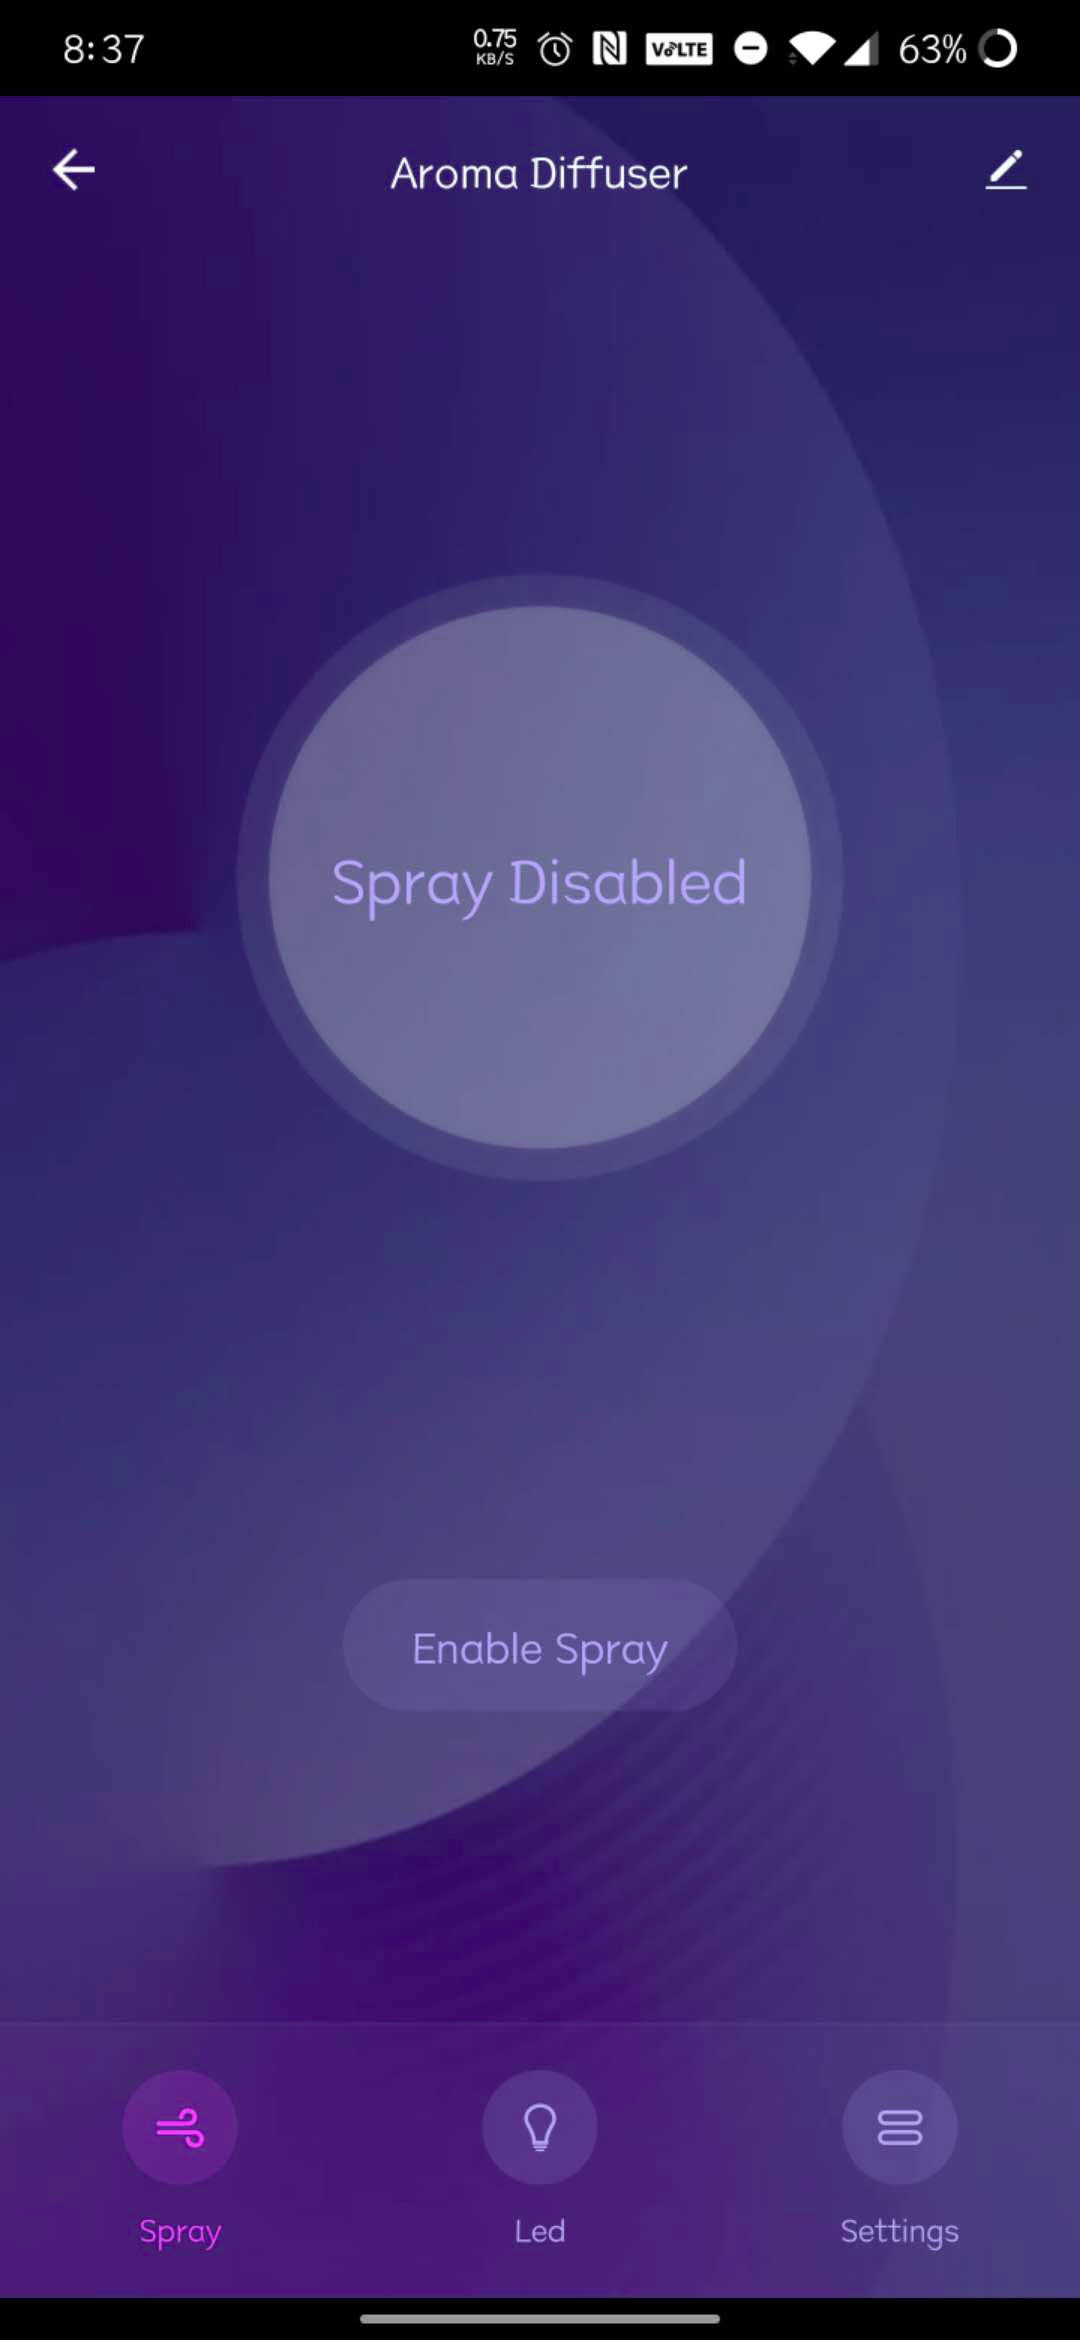
Test DP sending.
After the pairing is completed, you can select the DP sending on the app page. The MCU shall respond with the correct data according to the DP sent by the module.
After you turn on the device in the app, the panel background color changes accordingly. The data sent and responded is displayed on the left side of the debugging assistant:
Module simulation mode
After MCU code development is completed, you can use the Module Debugging Assistant in module simulation mode to verify the MCU code. In the module simulation mode, the assistant automatically sends the initial data flow to verify whether the MCU response is correct, and sends prompts for data error. After the initial interaction, you can click to test other extension functions.
You can choose a protocol as needed. This section takes Wi-Fi general protocol as an example to show you how to test the communication between a module and an MCU.
-
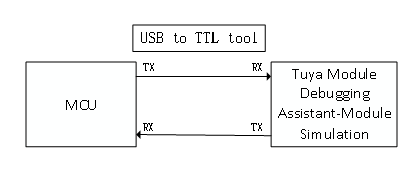
Connect the hardware.
Use the USB-to-TTL converter to connect the MCU serial port and the computer serial port. The schematic diagram is as follows:
-
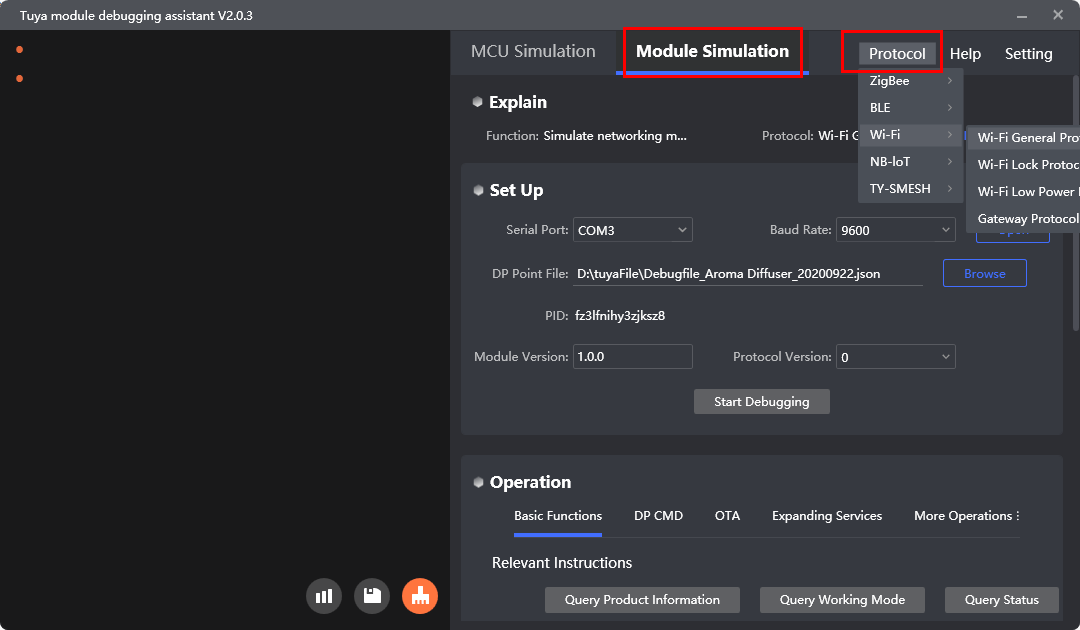
Select the communication protocol.
Click Protocol > Wi-Fi > Wi-Fi General Protocol, and click Module Simulation to enter the homepage of the simulation debugging assistant of the Wi-Fi module.
-
Configure startup options.
-
Select the correct serial port name and baud, click Open.
-
Click Browse to import the data point debugging file.
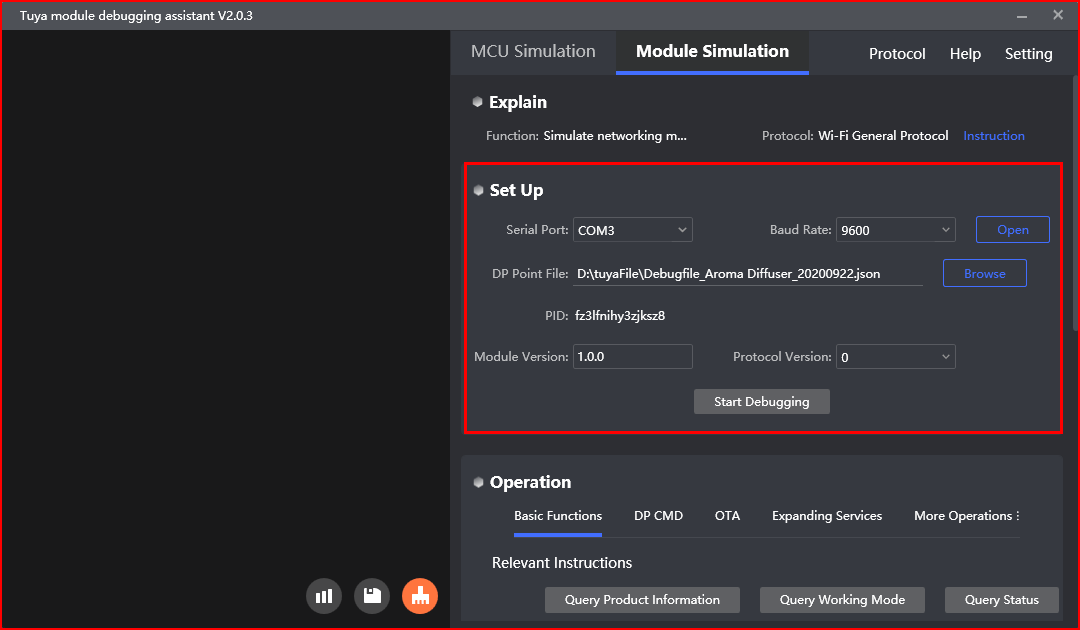
3. Click Start Debugging, and the assistant can work normally. The Initial Configuration section shows the parameters that shall be configured during initialization, which can be modified or kept as is. -
-
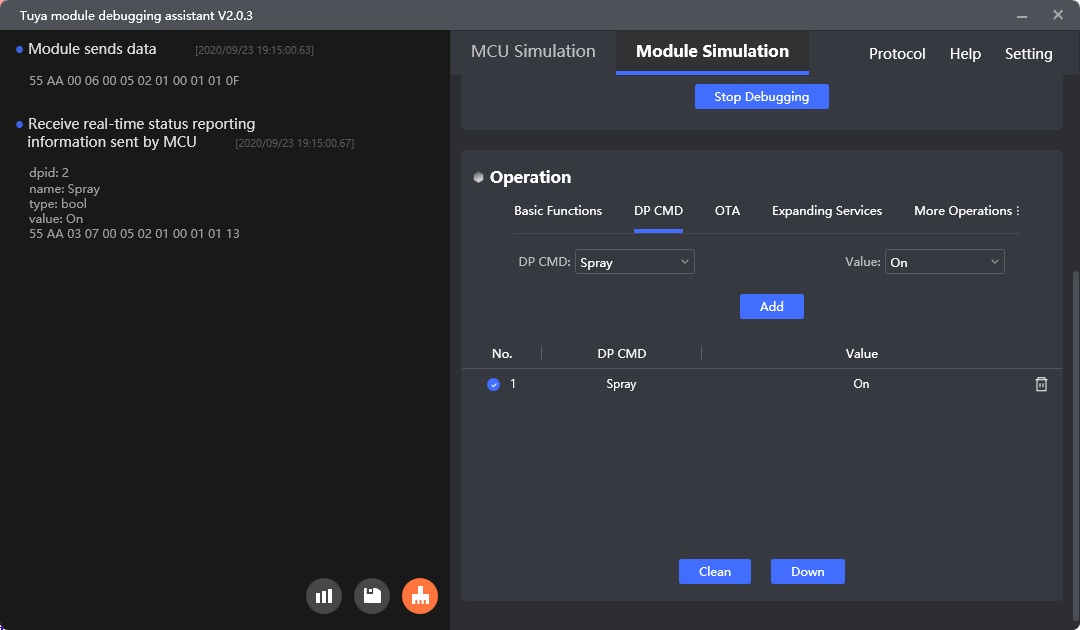
Functional test.
- After the debugging starts, you can see that the assistant automatically sends the initialization command. If the MCU responds correctly, it will automatically complete the initialization data interaction.
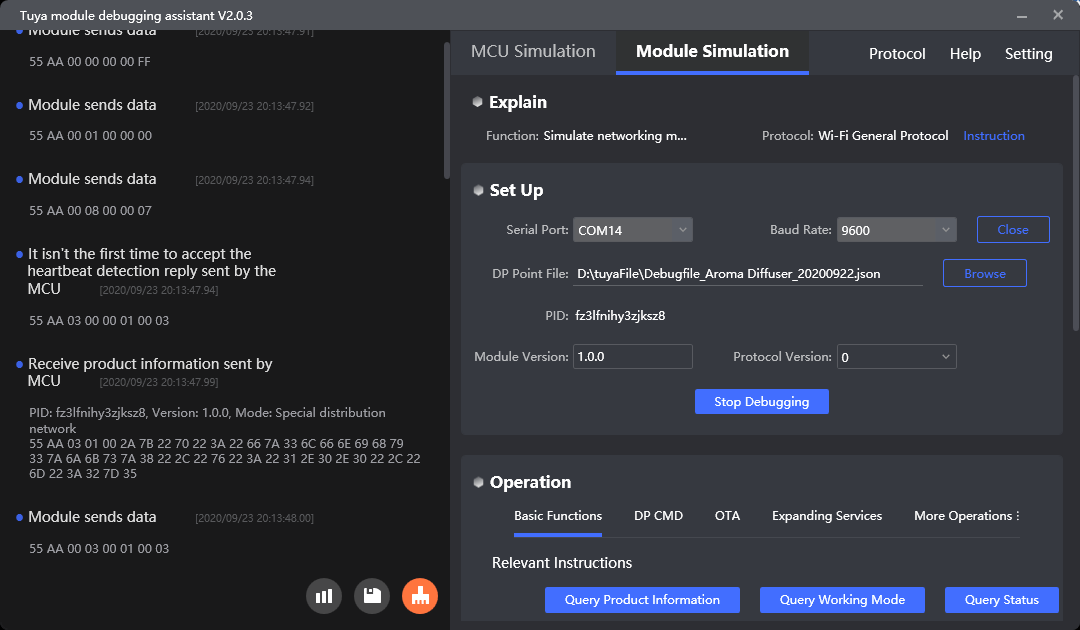
2. If the MCU responds with an error or timeout, there will be a corresponding prompt.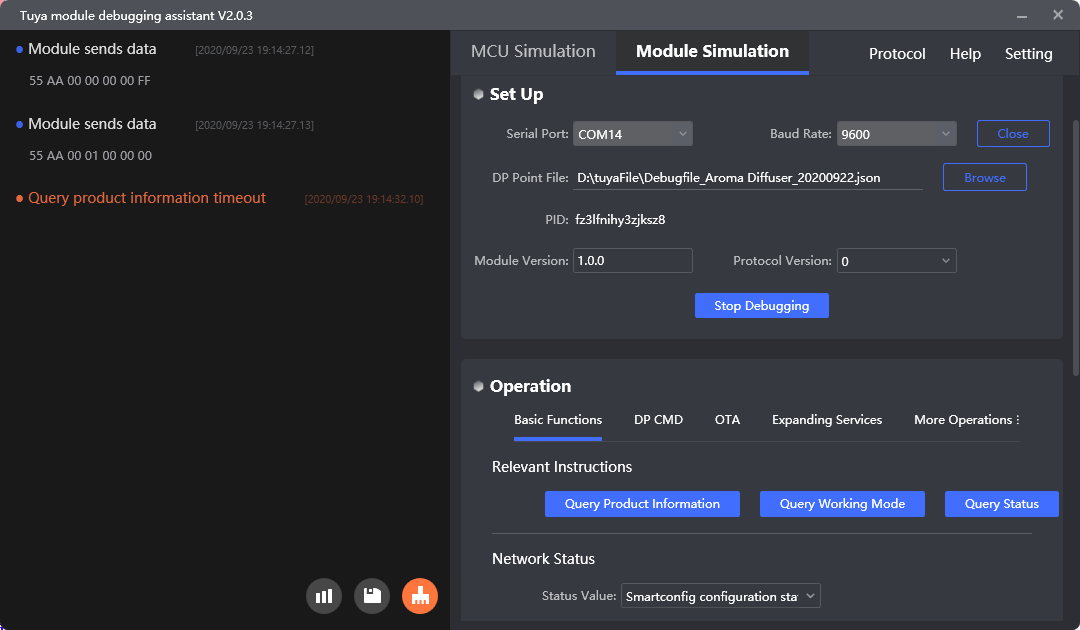
3. After initialization is completed, other functional tests can be performed. -
Click Send. The DP command shown on the right interface will be sent to the MCU. The assistant will parse the data returned from the MCU to determine whether the MCU provides the correct response.
-
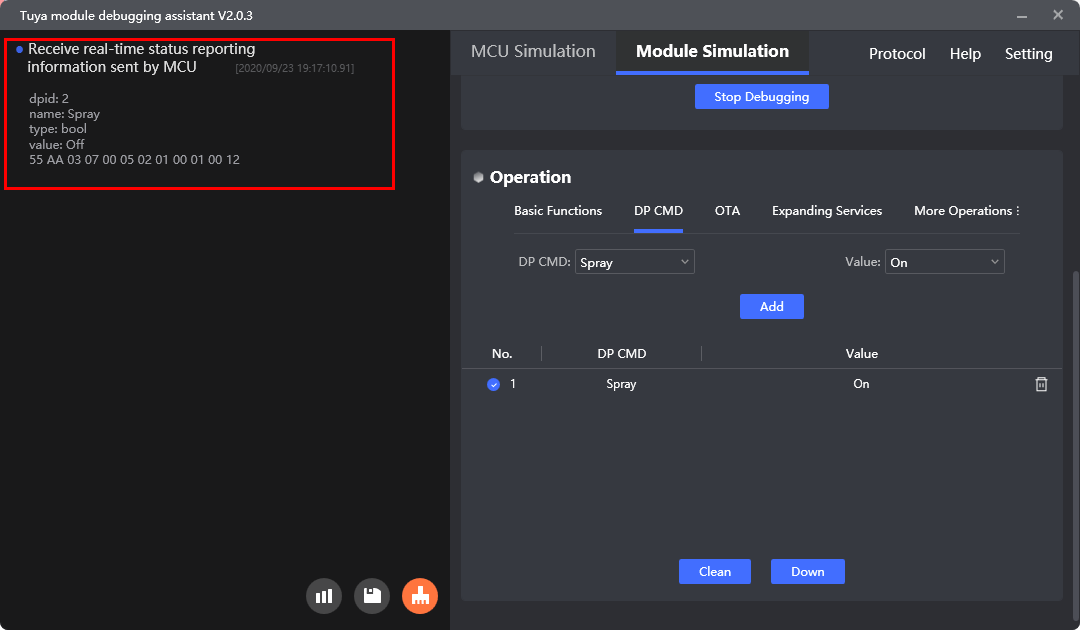
Test DP sending.
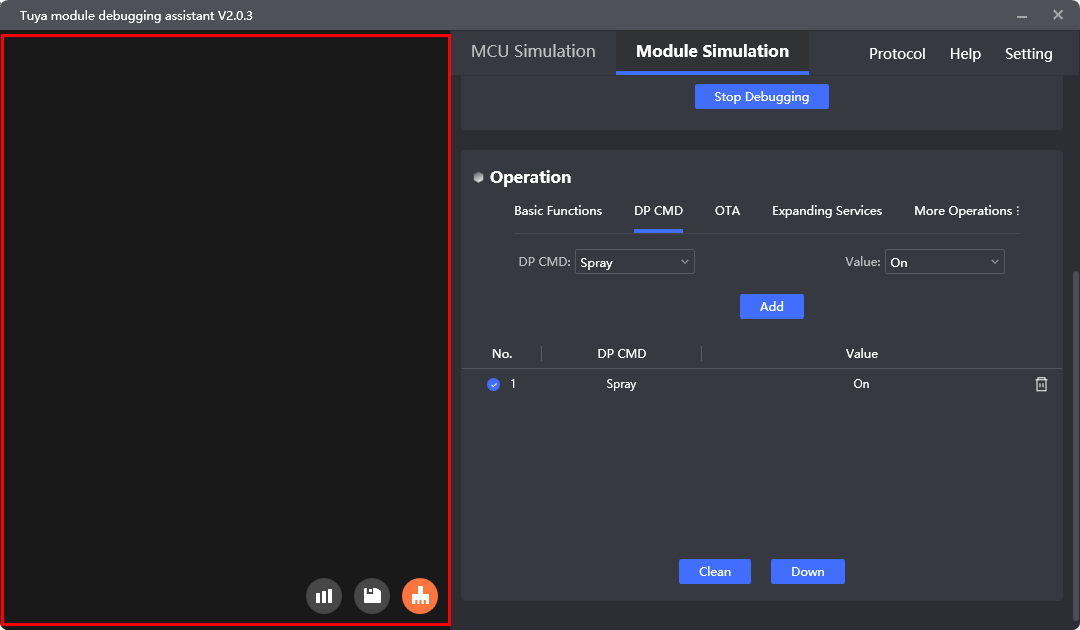
Click the DP CMD tab to enter the sending test page.
-
The DP command shows the name in the imported DP debugging file.
-
Value is the selectable or writable value of the DP command.
-
Click the Add button. The selected DP command and value will be written to the list box on the right.
-
Click Clean to clear the contents of the list box on the right.
-
Click Send. The DP data shown on the right will be sent according to the settings. The assistant will parse the data to determine whether the MCU response data is correct.
- Select a DP command: Options in the drop-down list show the
namefield in the imported DP debugging file. - Enter
Value: It is the selectable or writable value of the DP command. - Click Add. The selected DP command and value will be added to the list box on the right.
- (Optional) Click Clean to clear the selected items in the right list box.
- Click Send. The DP data shown on the right will be sent according to the settings. The assistant will parse the data to determine whether the MCU response data is correct.

- Select a DP command: Options in the drop-down list show the
If the data is sent and the MCU does not perform the corresponding function, you shall check the MCU code logic. For example, if the assistant sends the DP1 (switch DP) shutdown command, the MCU shall turn off the switch and report that the status of DP1 (switch DP) is shut down.
-
Miscellaneous
Page composition
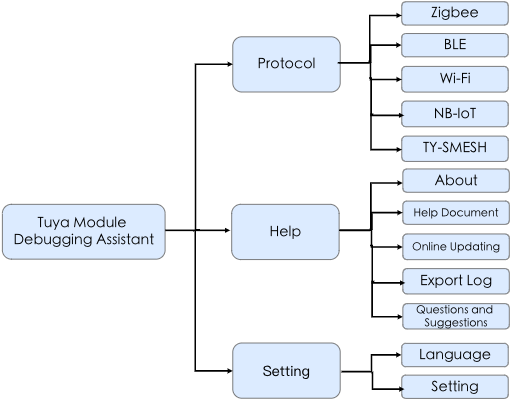
Tuya Module Debugging Assistant includes three functions: protocol, help, and setting.
-
The file contains language and setting functions.
-
The protocols are classified according to the role of the debugging assistant.
-
The help center contains the auxiliary functions of the software for locating problems and submitting feedback.
Public feature
-
Language
Click Setting > Language and select the corresponding language pack to switch the software language.
-
Parameters
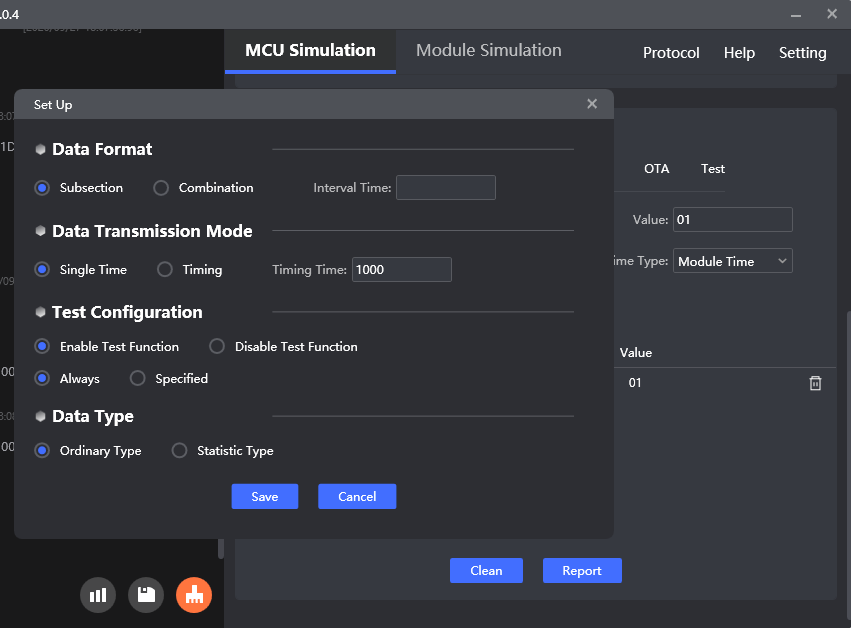
Click Setting > Setting to configure parameters, which are effective globally. It determines the DP reporting.
The setting page is as follows:
The time unit is in milliseconds.
Parameter Description Data Format The method of data reporting. Subsection means that the data is reported multiple times, and combination means that the data is spliced and reported once. The interval time indicates the intervals for the segment reporting. The data format determines how the DP is reported. Data Transmission Mode Single time is only one time, timing is multiple transmission, and each time interval is the timing time. This parameter is used for DP sending, reporting, and testing. Test Configuration It is valid only for testing. You can set whether commands are sent continuously or within a specific time period. Data Type The method of data reporting. The statistic type is reported with time, and the ordinary type is reported without time. Currently, it is only useful for Wi-Fi MCU debugging assistant. -
Serial data processing
The serial port data of each tool is displayed on the left side:
-
Display the data. Record the data sent and received by the serial port.
-
Save. Click Save to locally save the currently displayed data.
-
Clean. Click Clean to clean the displayed data.
-
-
Help center
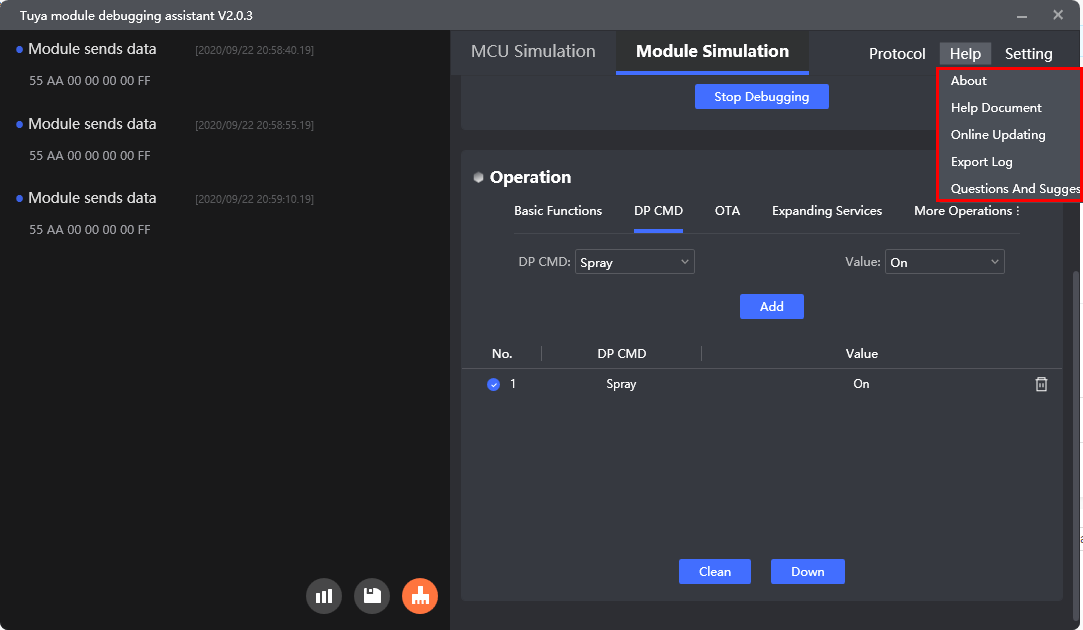
Interface option Description About View version information Help Document Enter the documentation center Online Updating Check for updates. Export Log The running log of the software will be copied to the selected folder, and the latest log file will be opened automatically. Questions and Suggestions Go to the Tuya Developer Platform to submit a ticket to give your feedback on any problem. -
Additional notes
Running record:
- The log is stored:
%Appdata%\Tuya\TYDEBUG\logs - The write operation directory of the software file is:
%Appdata%\Tuya%Appdata%\Tuya\TYB
- The log is stored:
Is this page helpful?
YesFeedbackIs this page helpful?
YesFeedback