Acoustic Structure Tuning
Audio quality test
Voice interaction is a fundamental feature of AI hardware. The quality of audio data during interaction serves as the foundation for ensuring product functionality and user experience. It is also a prerequisite for accurate speech recognition and precise comprehension/response from large language models. Therefore, every AI hardware product requires audio quality tests.
Tuya provides basic audio data test methods to help you get audio data and adjust product structure, hardware, and software accordingly during the development process. Therefore, this ensures the quality of audio data, improves the wake-up rate and voice recognition rate, and optimizes the large model interaction experience. The platform debugs audio data as .pcm data, 16-bit bit width, and 16 kHz sampling rate. Recommended software for viewing audio data: Adobe Audition or ocenaudio.
This topic applies only to onboard audio scenarios. For external voice chips, refer to the acoustic structure debugging method for the specific voice chip.
Audio processing workflow
AI conversation is based on traditional streaming media technology, sharing many similarities with VoIP and live video. Audio processing on the device consists of two parts: push stream and pull stream. Push stream includes microphone capture, 3A processing, and voice encoding. Pull stream includes voice decoding, audio processing, and speaker output.
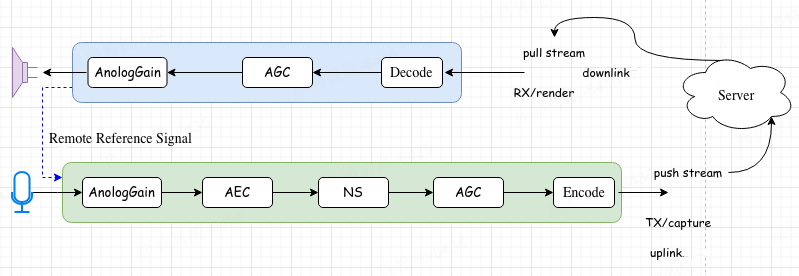
Explanation of terms in the diagram:
-
AGC: Auto gain control.
-
AEC: Acoustic echo cancellation.
-
NS: Noise suppression.
In addition to the components shown in the diagram, audio processing may also include other modules such as DRC (dynamic range compression) and VAD (voice activity detection). Among all audio modules, the AEC module has the most significant impact on voice interaction. The effectiveness of echo cancellation is not only related to the algorithm itself but also closely tied to hardware performance and acoustic/mechanical design. Due to the influence of hardware structure and design, audio processing must aim to remove as much echo as possible while preserving the near-end speech to ensure smooth AI voice conversation.
Acoustic structure test
Test tools
Use the official Tuya serial debugging tool tyuTool.
- This tool supports cross-platform operation (available in both GUI and CLI modes).
- While the application is running, it can send control commands via the serial port, play specified test audio, and dump audio channel data for analysis.
- For specific installation and usage instructions, refer to the README in its GitHub repository.
Test commands
After connecting to the device using the AI debug serial mode of tyuTool (or directly via a serial terminal), you can use the following commands to control recording and playback to assist with acoustic structure testing.
| Command | Functional description |
|---|---|
start |
Start recording and audio processing |
stop |
Stop recording and audio processing |
reset |
Reset the recording state |
bg 0 |
Play white noise |
bg 1 |
Play 1 kHz — 0 dB single-frequency tone |
bg 2 |
Play continuous sweep frequency (50 Hz to 7.5 kHz) |
bg 3 |
Play discrete frequency sweep (see frequency table below) |
bg 4 |
Play minimum single frequency (or use as a silence test) |
volume <0-100> |
Set playback volume (For example, volume 70 sets volume to 70%) |
micgain <0-100> |
Set microphone gain (For example, micgain 70). |
dump 0 |
Dump raw MIC input channel data |
dump 1 |
Dump reference (REF) loopback channel data |
dump 2 |
Dump audio data after AEC algorithm processing |
dump 3 |
Dump audio data sent to the KWS module |
dump 4 |
Dump audio data sent to the cloud AI agent |
Test steps
The design of the acoustic structure can be verified by playing test audio. Users can follow the steps below to play the corresponding audio, listen, or capture data for analysis.
- Connect the device: Use
tyuToolor another serial tool to connect to the device’s serial port. - Initialize the environment: Send the
resetcommand to clear any previously lingering recording state. Also, configure the appropriatevolumeandmicgainas needed. - Start capture: Send the
startcommand to begin recording audio data. - Play test audio: Send the
bg <mode>command. Available test audio includes:- 1 kHz single frequency (
bg 1): Duration 2 seconds, 0 dB. - White noise (
bg 0). - Continuous frequency modulation (
bg 2): 50 Hz to 7500 Hz continuous sweep. - Discrete frequency modulation (
bg 3): The table below shows frequency and duration information. - Silence/single frequency (
bg 4)
- 1 kHz single frequency (
- Stop capture: After the audio playback finishes, send the
stopcommand to stop capturing. The captured data will be cached on the device. - Capture data for analysis: Send
dump 0to capture microphone data, anddump 1to capture speaker loopback reference data. Import the captured.pcmdata intoAdobe Auditionorocenaudiofor waveform and spectrum analysis to check for phenomena such as harmonic distortion, DC bias, or clipping.
Automated test
To simplify the operation, tyuTool provides an automated audio test command.
- Execute automated test: Enter the corresponding command in the serial interface or CLI. For more information, see the
ser_automode in the tool’s help. - Test process: The tool will automatically execute the following sequence:
- Play and capture white noise data.
- Play and capture 1 kHz - 0 dB single frequency data.
- Play and capture silence data.
- Automatically generate report: After all data capture is completed, the tool will automatically invoke an audio analysis algorithm to generate and output a test report. The report covers items such as DC bias, clipping distortion, total harmonic distortion (THD), and delay stability.
Frequencies for discrete frequency modulation tests
| Frequency (Hz) | Duration (s) | Amplitude (Normalized) |
|---|---|---|
| 1000 | 0.5 | 0.8 |
| 7500 | 0.3 | 0.8 |
| 5800 | 0.3 | 0.8 |
| 4500 | 0.3 | 0.8 |
| 3500 | 0.3 | 0.8 |
| 2750 | 0.3 | 0.8 |
| 2150 | 0.3 | 0.8 |
| 1700 | 0.3 | 0.8 |
| 1300 | 0.3 | 0.8 |
| 785 | 0.3 | 0.8 |
| 600 | 0.3 | 0.8 |
| 475 | 0.3 | 0.8 |
| 370 | 0.3 | 0.8 |
| 285 | 0.3 | 0.8 |
| 225 | 0.3 | 0.8 |
| 175 | 0.3 | 0.8 |
| 135 | 0.3 | 0.8 |
| 100 | 0.3 | 0.8 |
| 80 | 0.3 | 0.8 |
| 65 | 0.3 | 0.8 |
| 50 | 0.3 | 0.8 |
One or more of the aforementioned signals can be played back to assess the performance of the speaker and microphone. For instance, detect the presence of harmonic distortion, DC bias, or clipping.
Audio issues
DC bias
DC bias refers to a constant DC voltage component superimposed on an audio signal, causing the entire signal to deviate from the zero level (reference level). This phenomenon might be caused by hardware devices, circuit design, or issues during signal transmission, and it negatively impacts audio quality.
The diagram below shows a schematic comparison of an audio waveform with DC bias and a normal audio waveform:
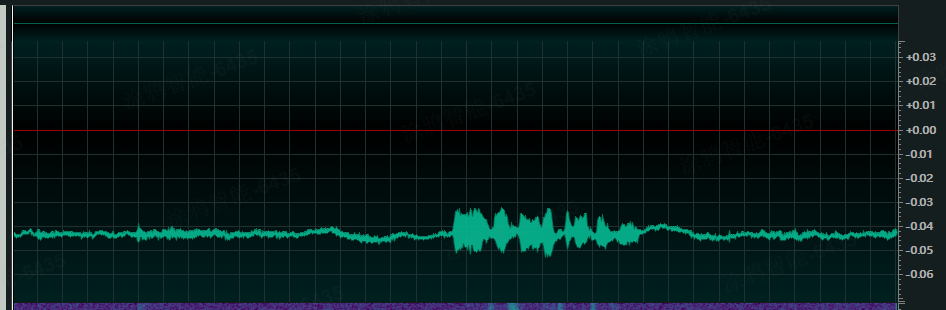
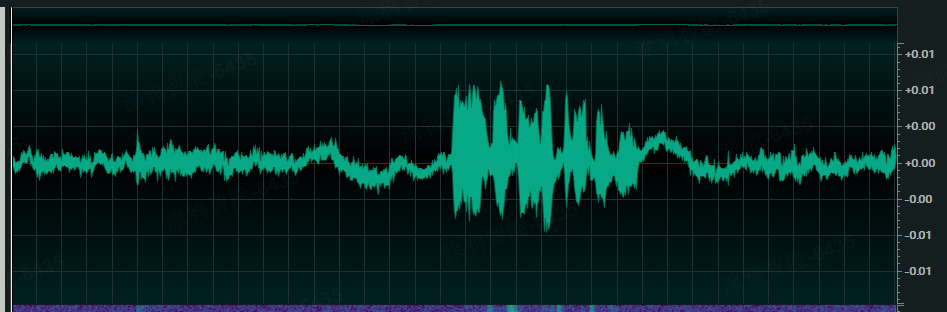
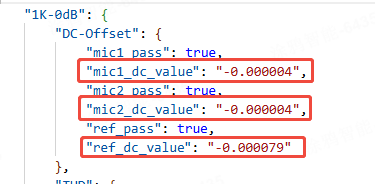
A slight DC bias has minimal impact on audio processing. However, a large DC bias can affect the dynamic range of the audio, leading to clipping distortion. If the bias is higher than 0.01 or lower than -0.01, it is recommended to apply a DC bias removal algorithm, such as a high-pass filter. Both single-frequency tones and white noise in the test program can be used to calculate the DC bias.
Clipping distortion
When the audio signal exceeds the maximum value representable by the audio’s digital range, clipping distortion occurs. As some platforms use hardware loopback circuits, it is necessary to evaluate the loopback signal and the microphone signal separately.
Scenario 1: For example, when playing a 1 kHz single-frequency tone, the REF signal is normal, but the microphone captured signal shows clipping, as illustrated below:
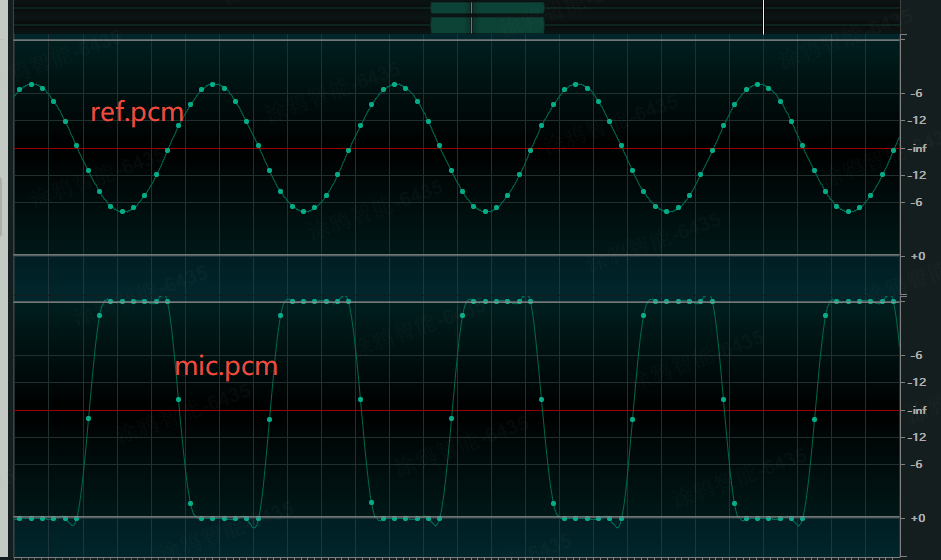
This might be caused by the microphone being too close to the speaker, so you need to adjust their relative positioning. If you are unable to adjust their relative positioning, you can lower the micgain value within the script.
Scenario 2: The REF signal shows clipping, but the microphone signal is normal, as illustrated below:
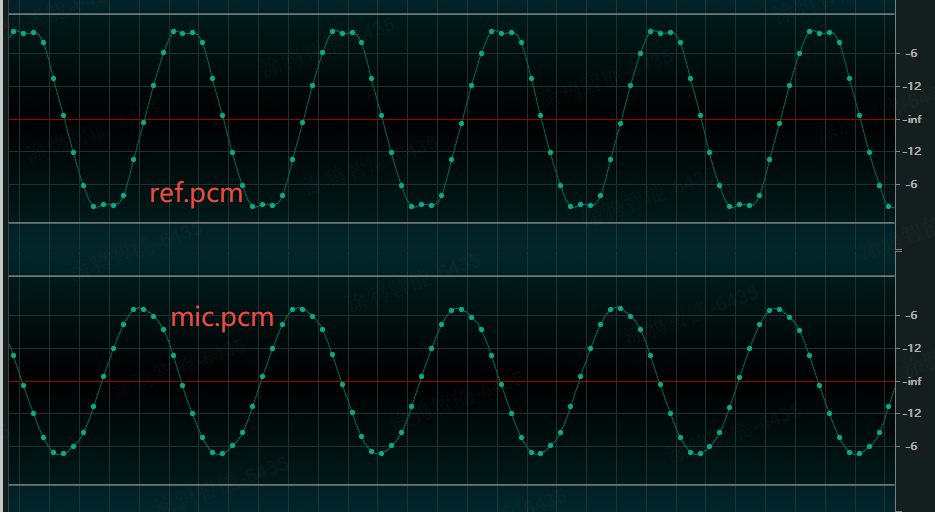
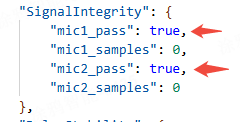
This might be caused by excessive speaker volume, so you need to lower the playback volume. Reduce the playback loudness of the speaker by lowering the volume. The image below shows a clipping detection passed result in the test output. If the test fails, the samples field records the total number of samples where clipping was detected.
Total harmonic distortion (THD)
THD is an important indicator of signal distortion. It describes the proportion of harmonic components to the fundamental component in the output signal, reflecting the system’s ability to faithfully reproduce the original signal. In practice, due to the non-linear characteristics of components (such as the non-linear region of transistors or the non-linear vibration of a speaker diaphragm), the output signal generates additional harmonics—frequency components that are integer multiples of the input signal’s fundamental frequency (such as the 2nd harmonic and the 3rd harmonic). The test script provides THD calculation results based on a 1 kHz test signal. Generally, exceeding the speaker’s rated power is a common cause of high THD. It is recommended to lower the speaker volume if the THD test fails. Additionally, poor quality of either the speaker or the microphone can also contribute to high THD.
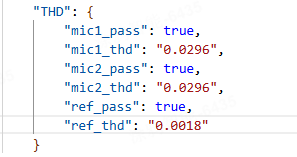
The general recommended limit for THD is 5% (0.05). A value higher than this indicates a THD test failure.
Microphone consistency
The test program supports acoustic verification for dual-microphone configurations. For dual-microphone processing algorithms, such as Beamforming, good consistency between the two microphones is required. If the microphone consistency is poor, it is recommended to replace the microphones.
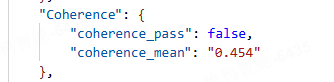
A higher correlation coefficient indicates better consistency. The ideal value is 1.0, and it is recommended that this value be higher than 0.7.
Delay stability
Issues such as frame loss, data loss, or processing exceptions can cause the microphone and loopback channel data to become misaligned, resulting in delay instability. The test program can perform delay calculations to evaluate delay stability.
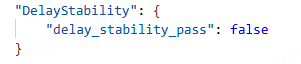
If this test fails (False) , it indicates that the delay fluctuation is excessive, which will have a significant negative impact on AEC performance. In such cases, it is necessary to capture specific data based on the business context for detailed analysis and troubleshooting.
Support
If you have any problems with TuyaOS development, you can post your questions in the Tuya Developer Forum.
Is this page helpful?
YesFeedbackIs this page helpful?
YesFeedback