Debug Product Panel
This topic describes how to debug the panel of a product.
Prerequisites
- The development environment is built.
- The product is created.
- The project is initialized.
- The host and the mobile phone are connected to the same Wi-Fi network for debugging.
Procedure
Debugging for iOS
-
Click RN Panel Dev to download and install Tuya Panel TestFlight app.
You need to open this link on your mobile phone for installation.
-
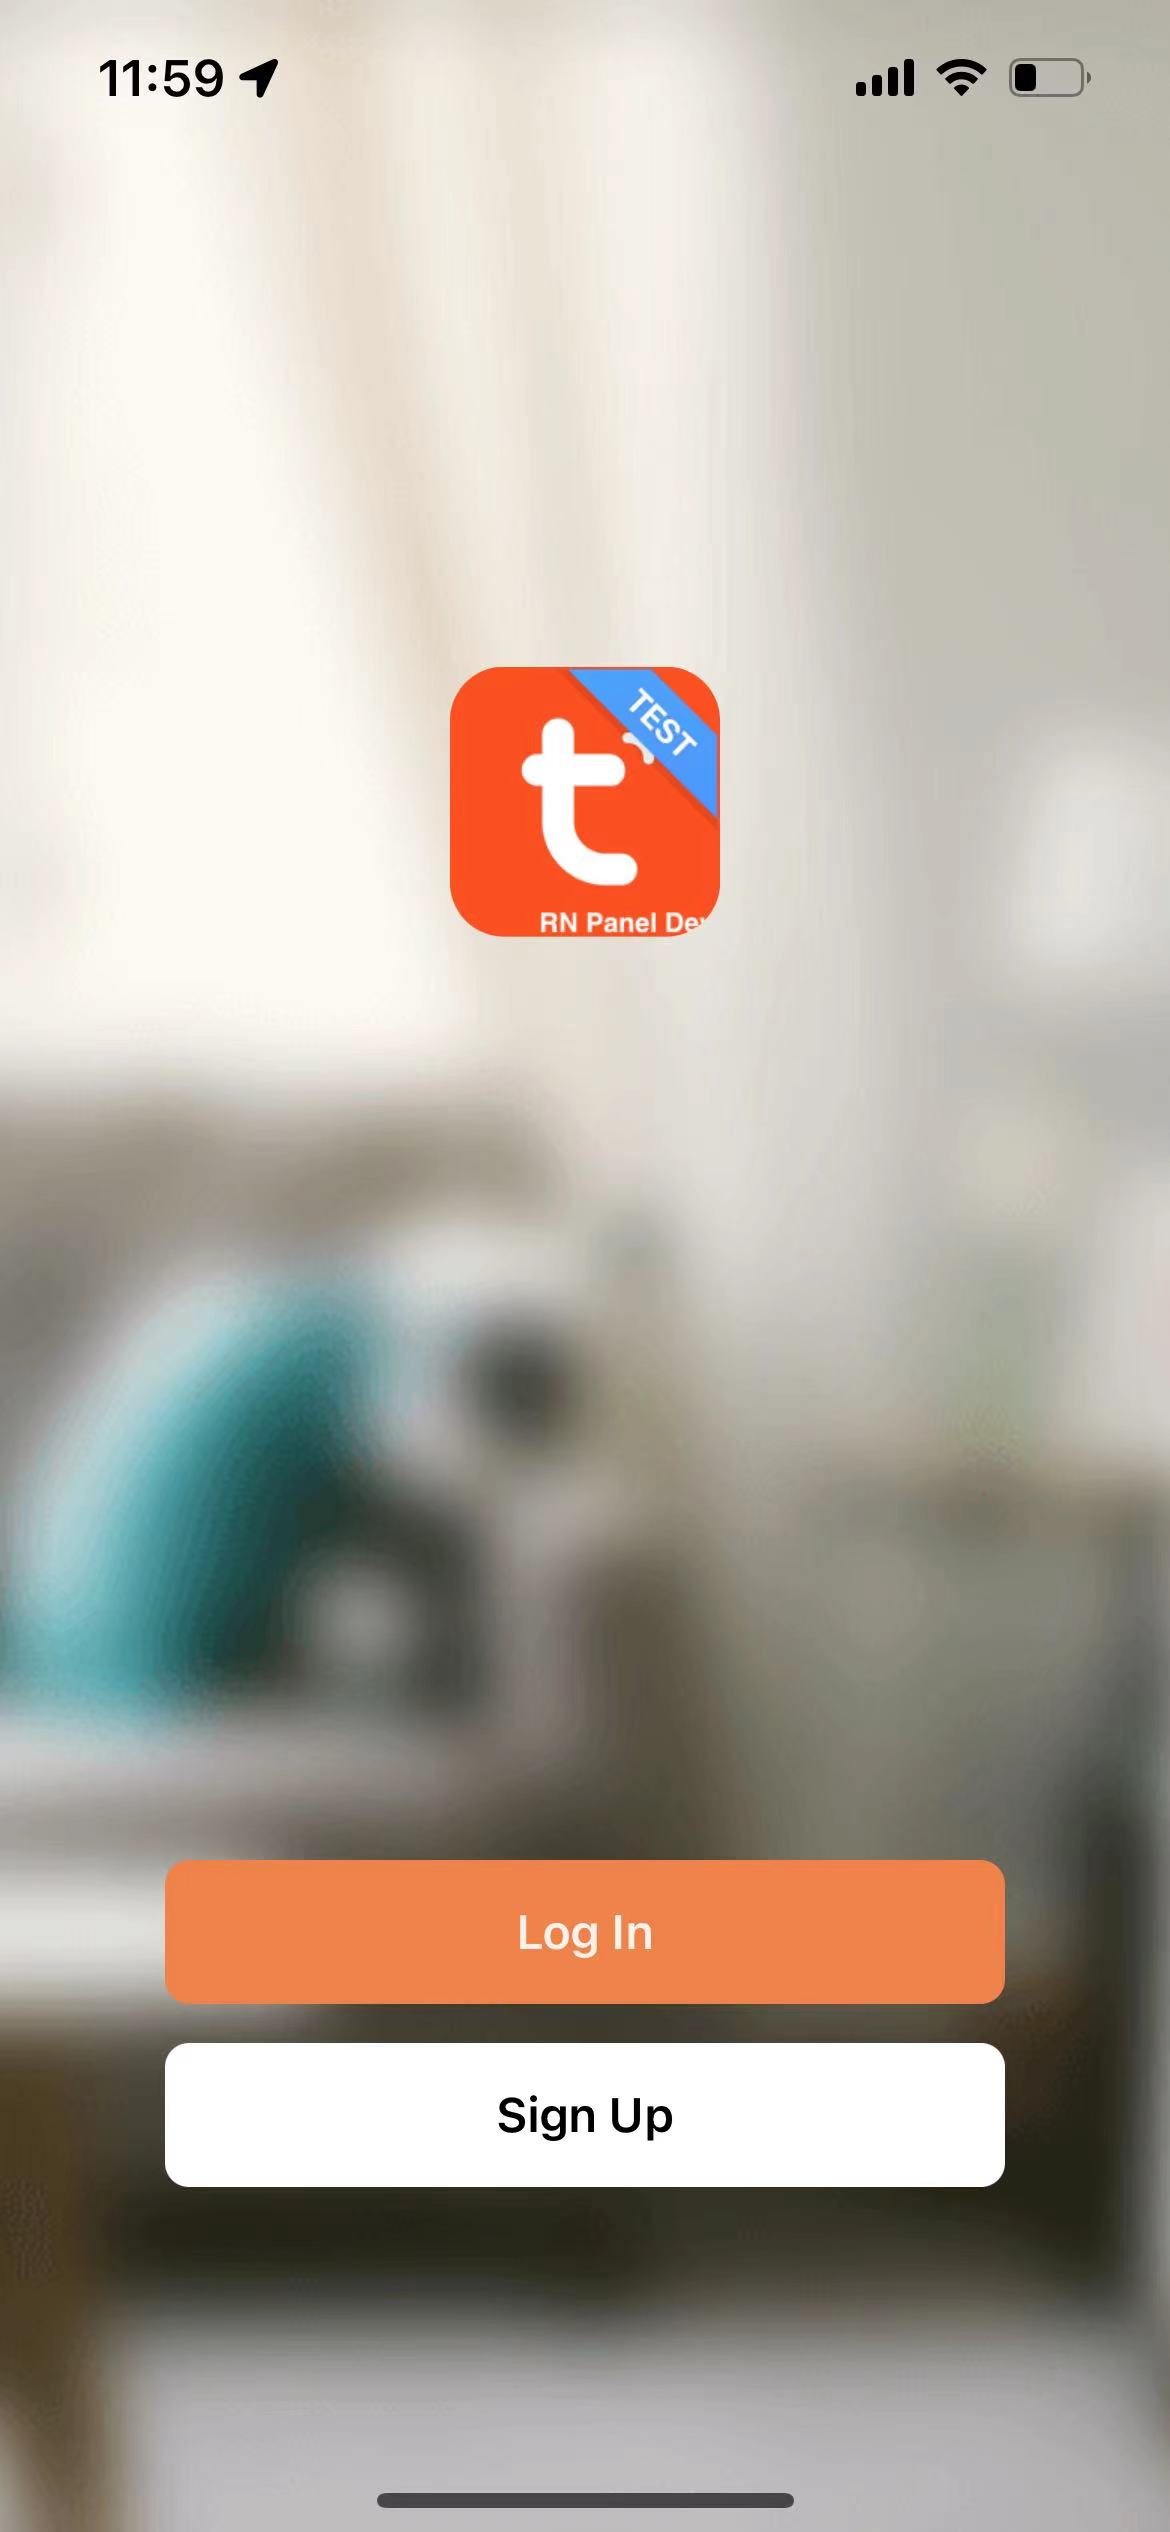
If you have not registered an account of the app, register one and log in to the app.
-
Tap Me at the bottom > Scan icon in the top right corner. The camera permission must be enabled before the scan feature can be used.
-
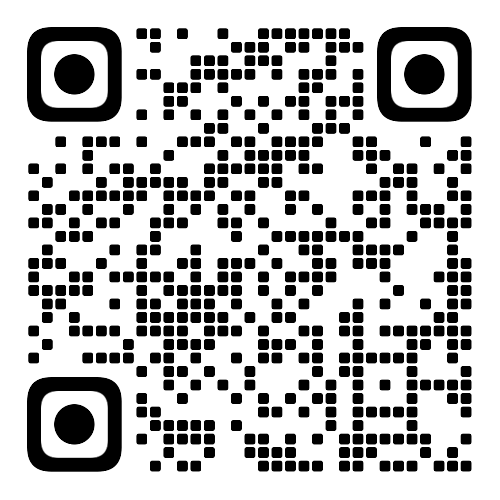
Scan the QR code to open the page of RN panel debugging settings.
-
Configure RN debugging parameters.
-
Tap the switch button at the top to enable the RN debugging mode.
-
Configure the debugging information.
- Product ID: The PID of the product to be debugged. View the PID information on the Smart Products page of the Tuya Developer Platform.
- Debugging IP address: The IP address of the network to which the device for debugging is connected.
- Debugging port: The port number of the device for debugging. The port number is
8081by default. - Bundle name: The name of the local Bundle. The name is
index.ios.bundleby default.
-
-
Go back to the homepage of the RN Panel Dev app and select a panel.
-
Shake the mobile phone, select Reload in the dialog box, and then load the local resource package.
-
(Optional) You can shake the mobile phone, and view the debugging log or enable Hot Reloading.
Debug panel for Android
- Scan the QR code for the RN Panel Dev app to install the RN Panel Dev app.
- Configure the debugging tool.
-
Find and log in to com.ty.panel.dev application.
com.ty.panel.dev is installed when the RN Panel Dev app is installed.
-
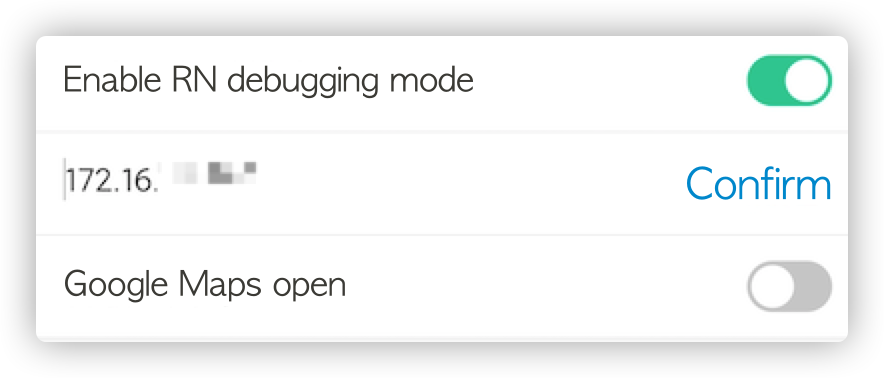
Enter the IP address of the host and tap Confirm.
-
Tap Enable RN debugging mode to start debugging.
-
Debug the panel.
-
Register and log in to the RN Panel Dev app.
-
Scan the QR code of the created product panel to add a virtual device. For more information about getting the QR code of a virtual device, see Select the device panel.
-
In the RN Panel Dev app, log in to the specified panel interface.
-
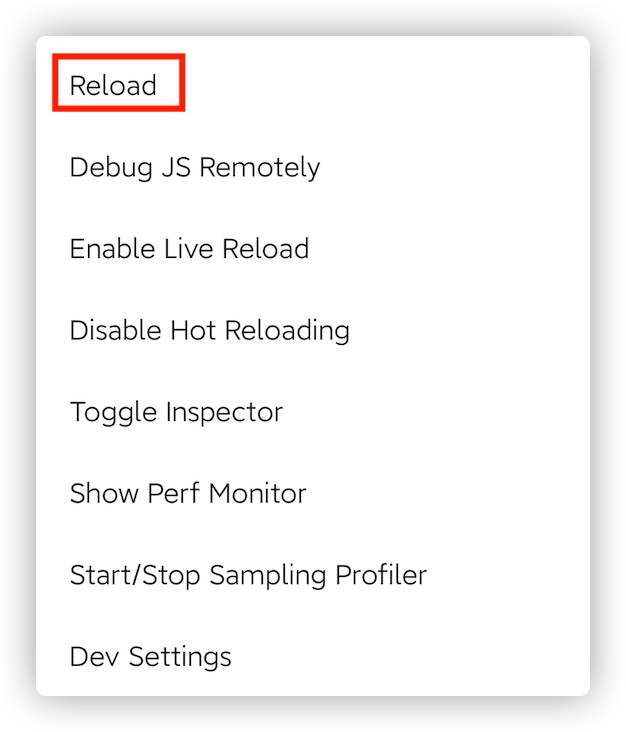
Shake the mobile phone, select Reload in the dialog box, and then load the local resource package.
-
(Optional) You can shake the mobile phone, and view the debugging log or enable Hot Reloading.
-
-
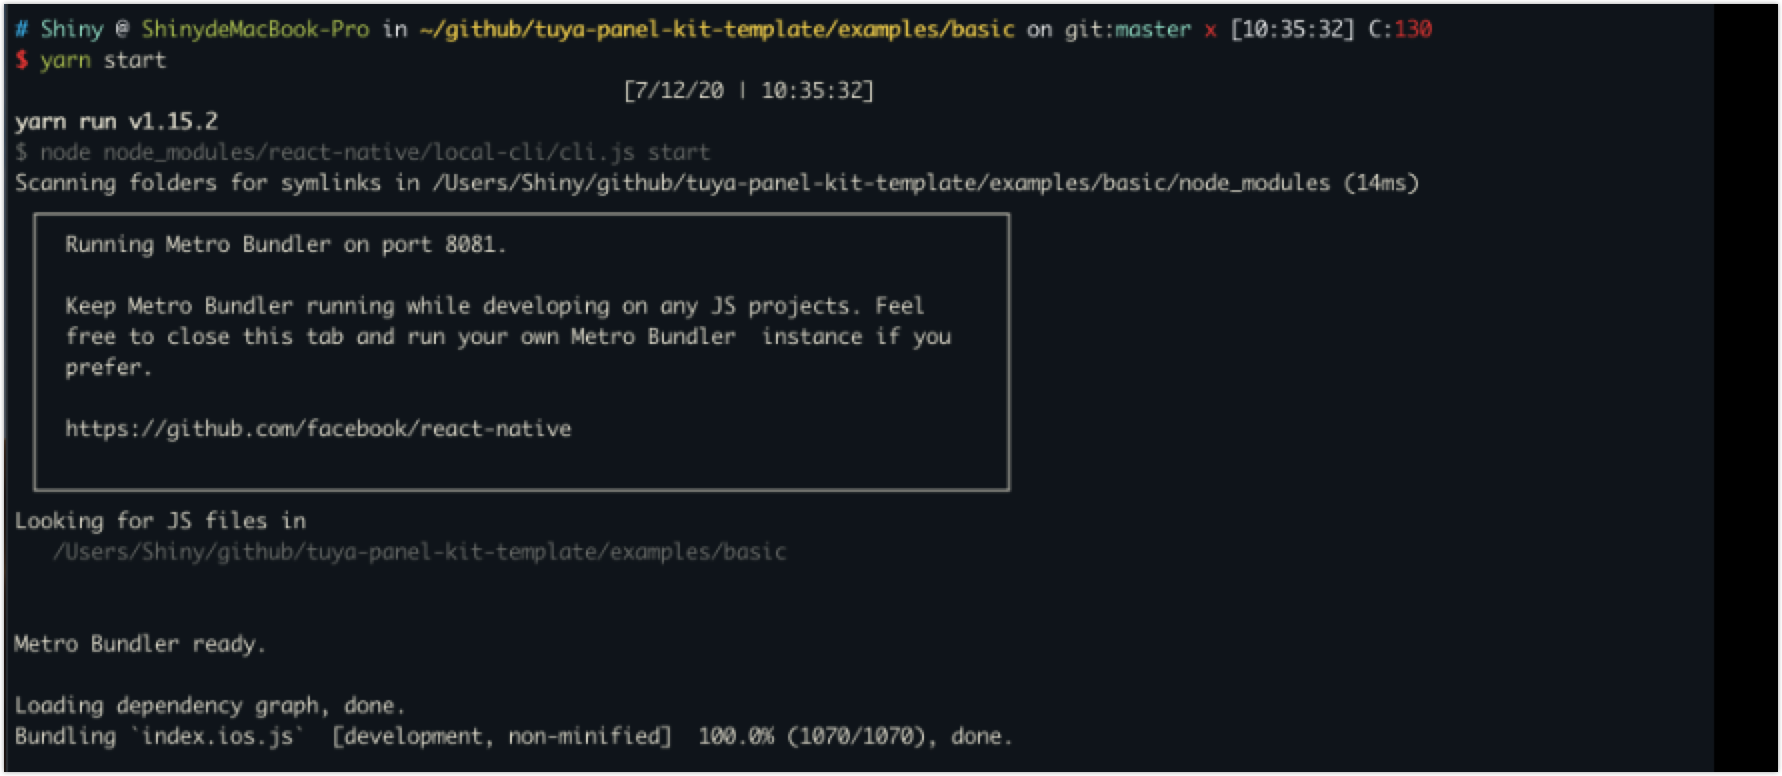
Operation result
The following figure shows the successful panel debugging based on examples/basic.
Is this page helpful?
YesFeedbackIs this page helpful?
YesFeedback


