Data Point Analytics
The data point analytics shows the usage distribution of product data points (DPs) and their usage in smart scenes of apps. You can leverage this feature to quickly gain a panoramic view of the usage of product functionality.
For example, if the utilization rate of the wind direction adjustment DP for a smart heater is only 5%, you might need to optimize this DP.
Terms
-
Frequency of DP usage: the number of operations of the device DPs under the account during a statistical period.
-
Percentage of DP usage: the ratio of the number of times that a single DP type and name are used to the number of times that all DPs are used.
-
Frequency of DP in scenes: the number of times that the DPs are used in tap-to-run and automation scenes under the account during a statistical period.
-
Percentage of DP in scenes: the ratio of the number of times that a single DP name is used to the number of times that all DPs are used in all scenes.
Feedback trend
Data point usage
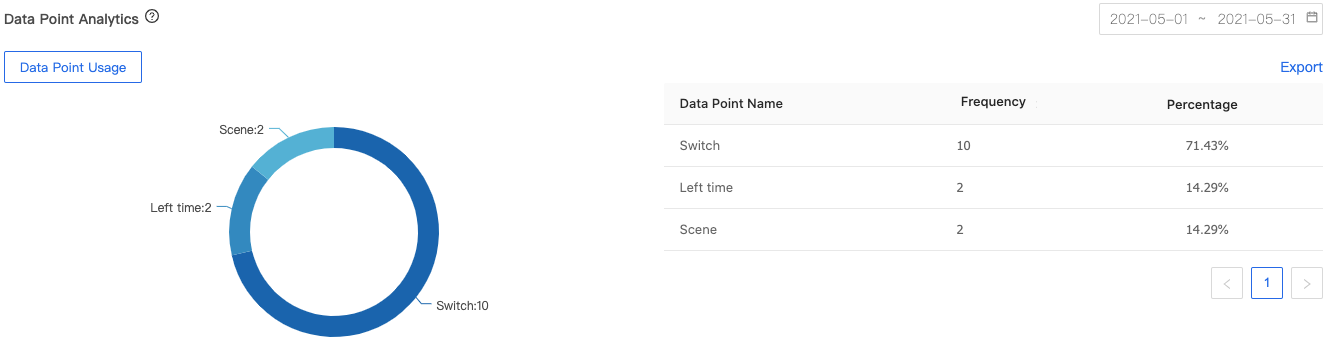
-
Frequency of DP usage: the number of operations of the device DPs under the account during a statistical period.
-
Percentage of DP usage: the ratio of the number of times that a single DP type and name are used to the number of times that all DPs are used.
Data point in scenes
- Frequency of DP in scenes: the number of times that the DPs are used in tap-to-run and automation scenes under the account during a statistical period.
- Percentage of DP in scenes: the ratio of the number of times that a single DP name is used to the number of times that all DPs are used in all scenes.
Is this page helpful?
YesFeedbackIs this page helpful?
YesFeedback