Quick Start
Last Updated on : 2024-06-20 06:18:35download
Currently, data visualization has been formally released. You can purchase the specified plan and build a data visualization screen to visually present data as preferred.
How to purchase
-
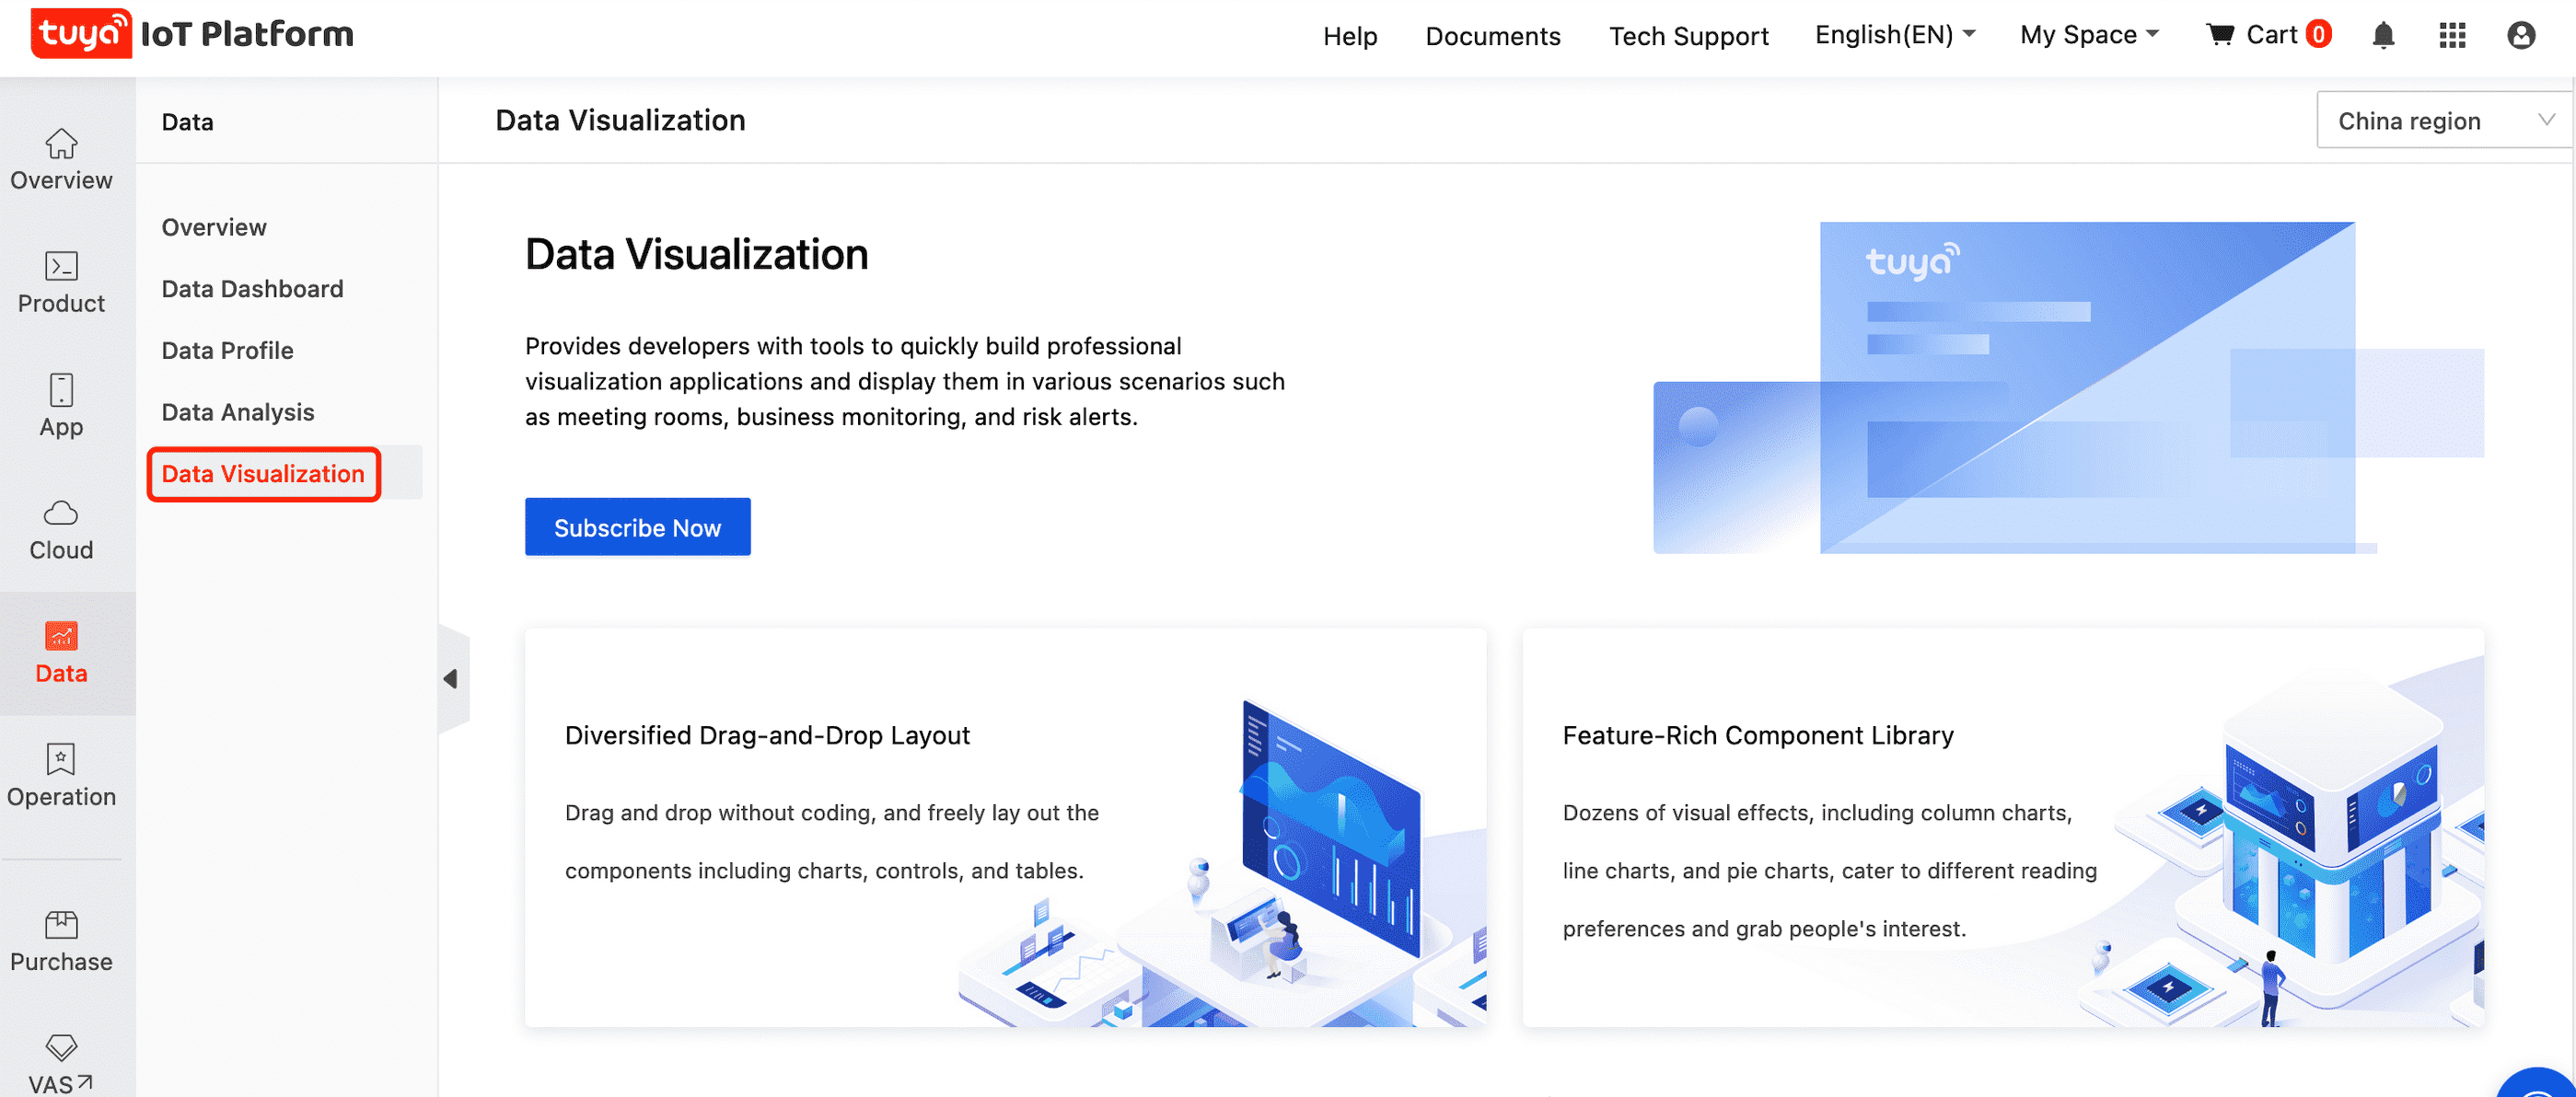
Log in to the Tuya Developer Platform and choose Data > Data Visualization.
-
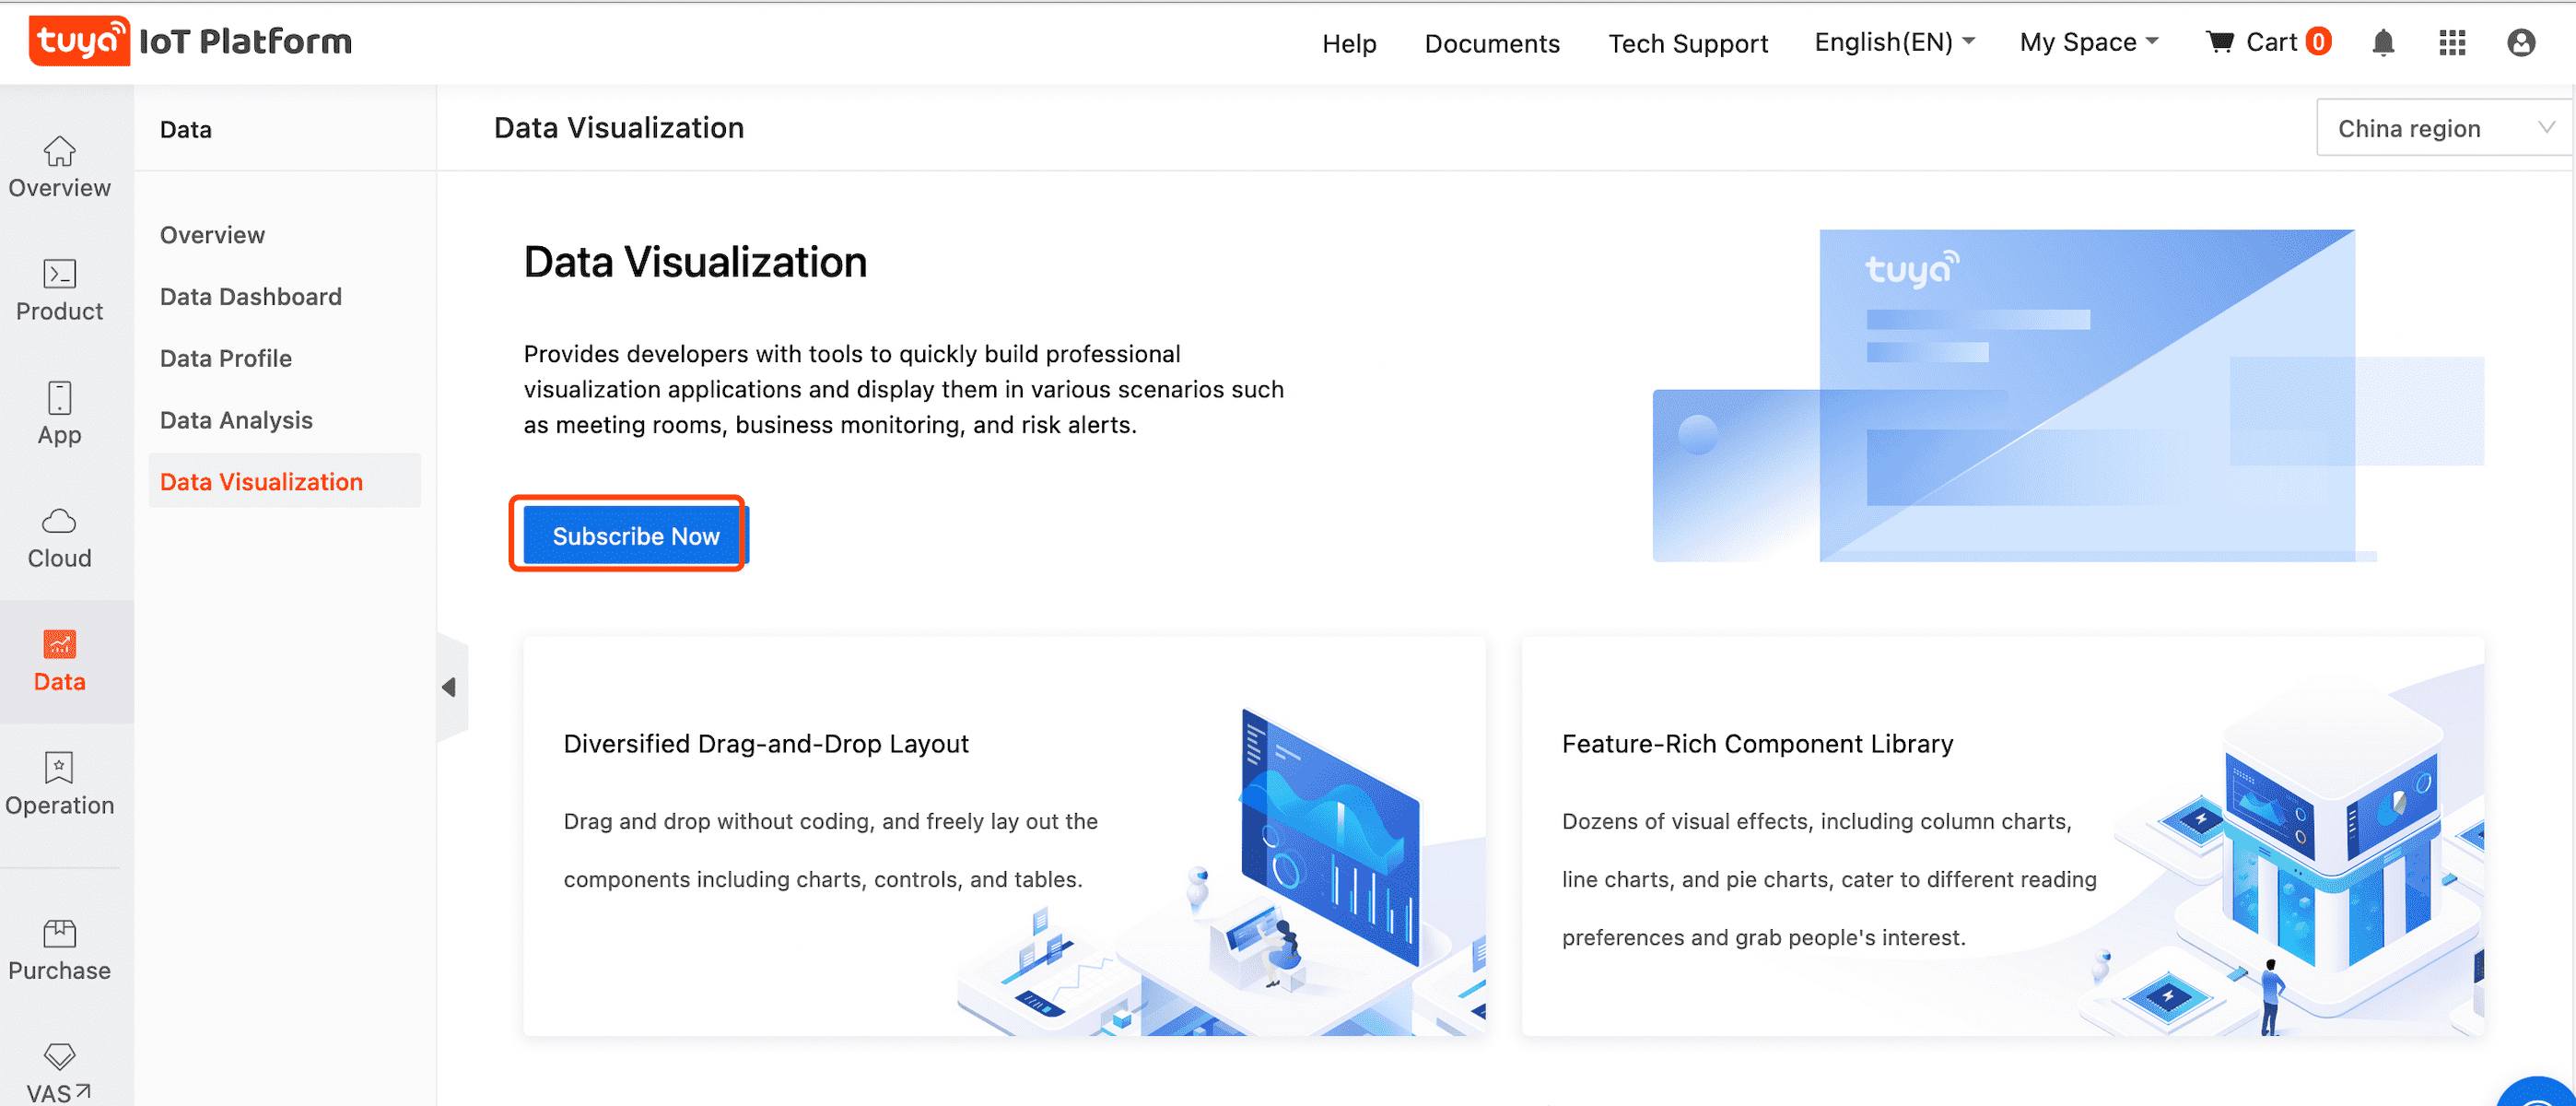
Click Subscribe Now.
-
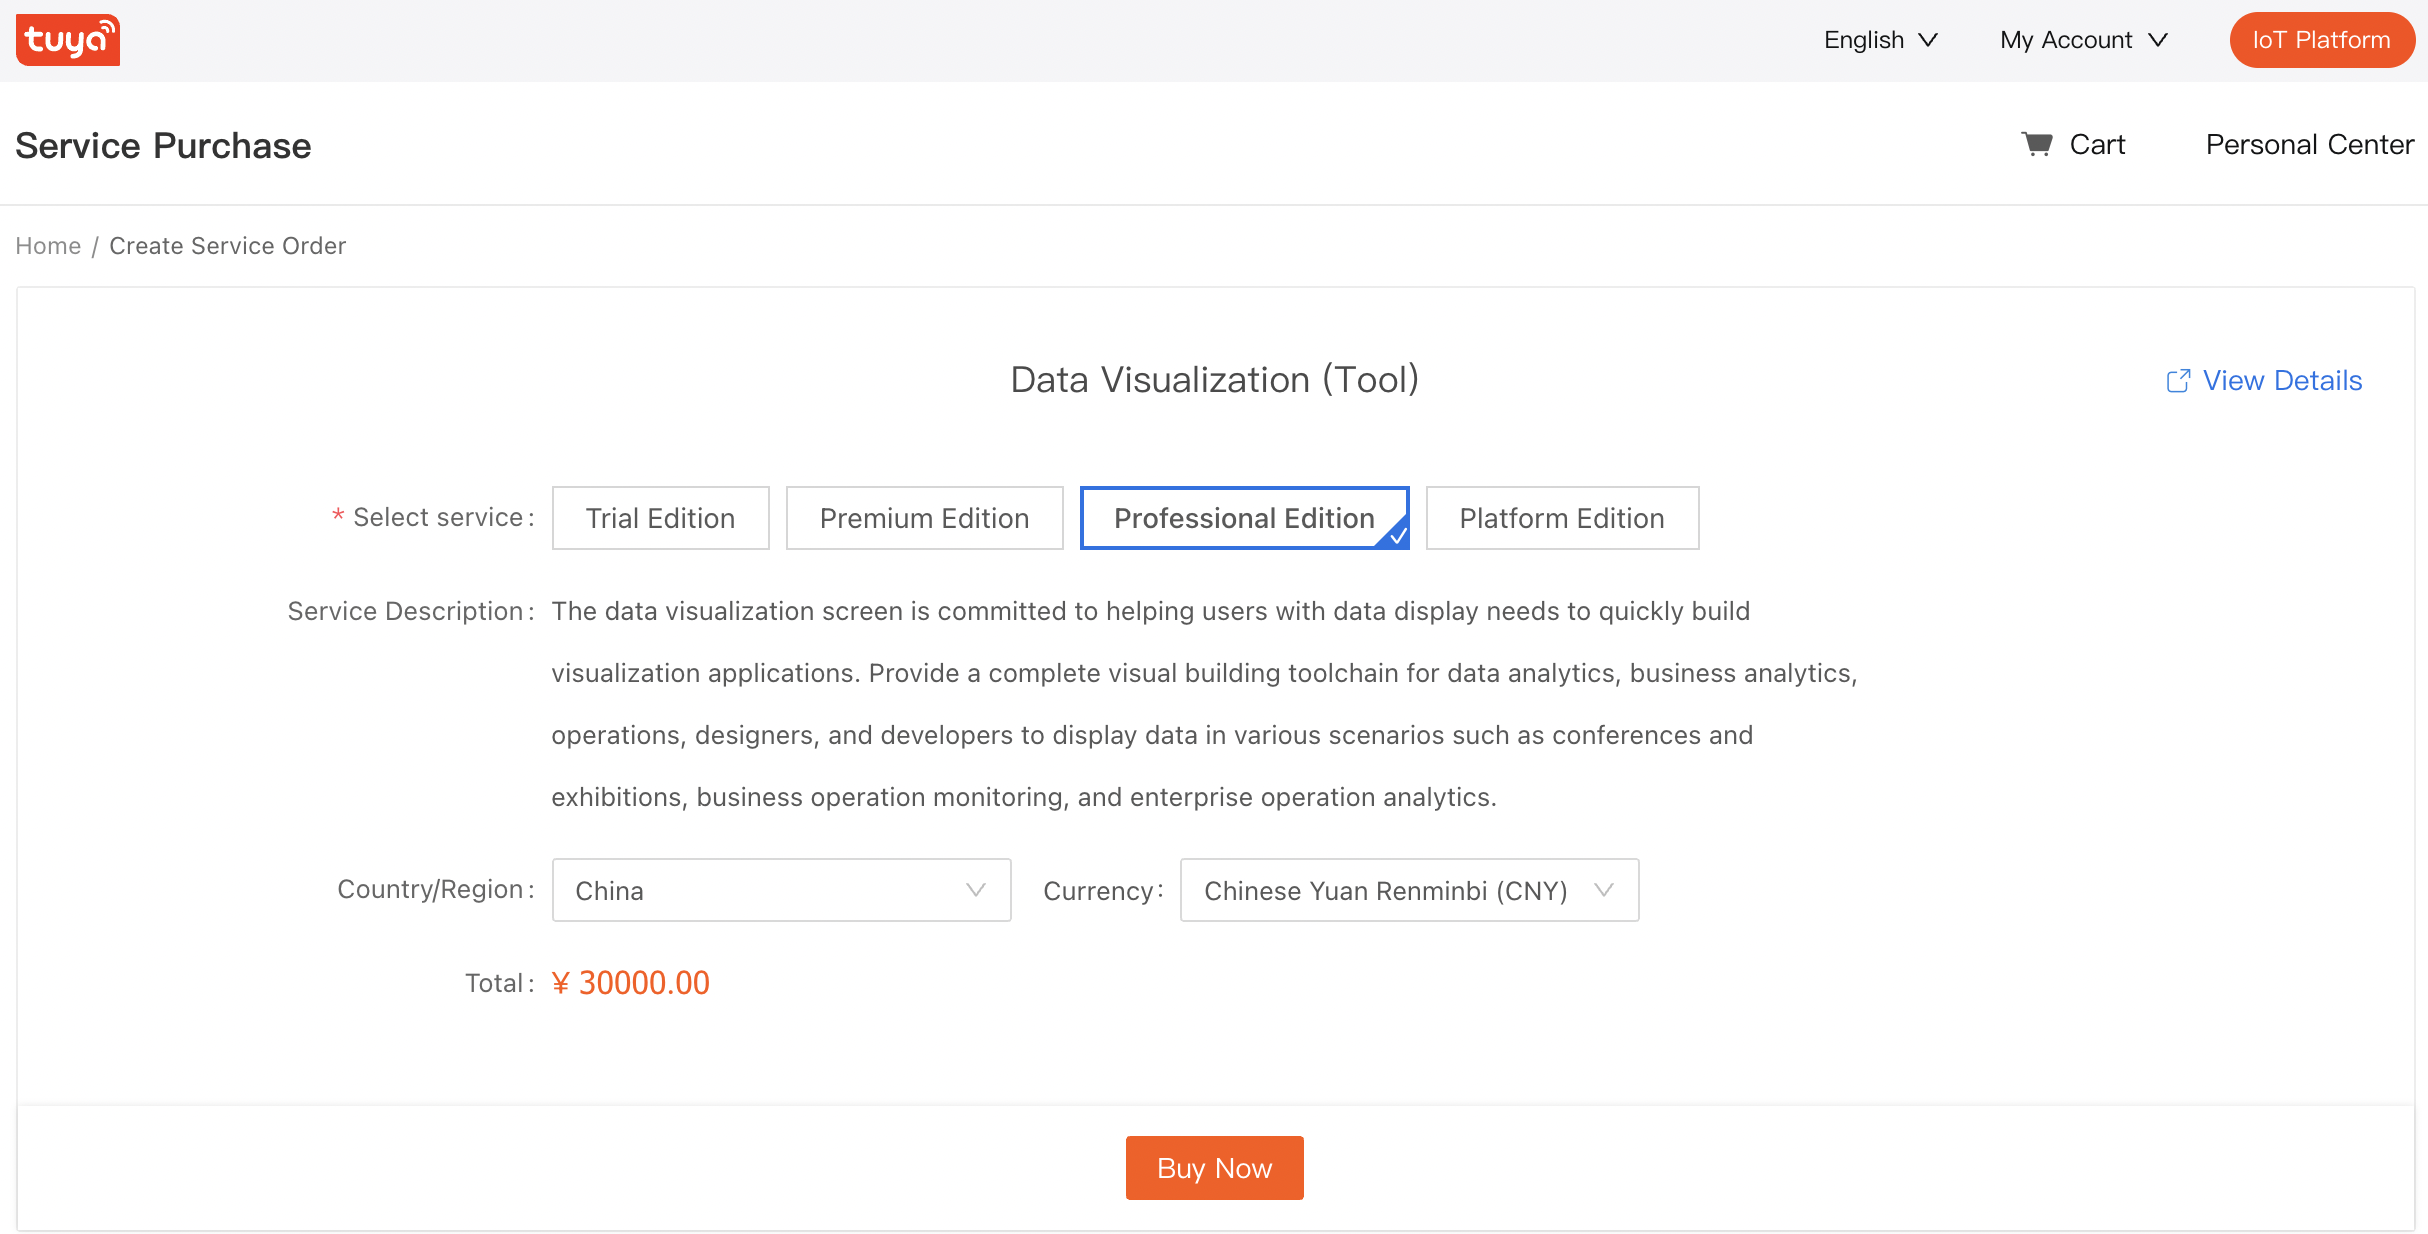
On the page of value-added services, select the desired service and purchase the plan. After the purchase is successful, the list of screens is shown.

Create a visualization application
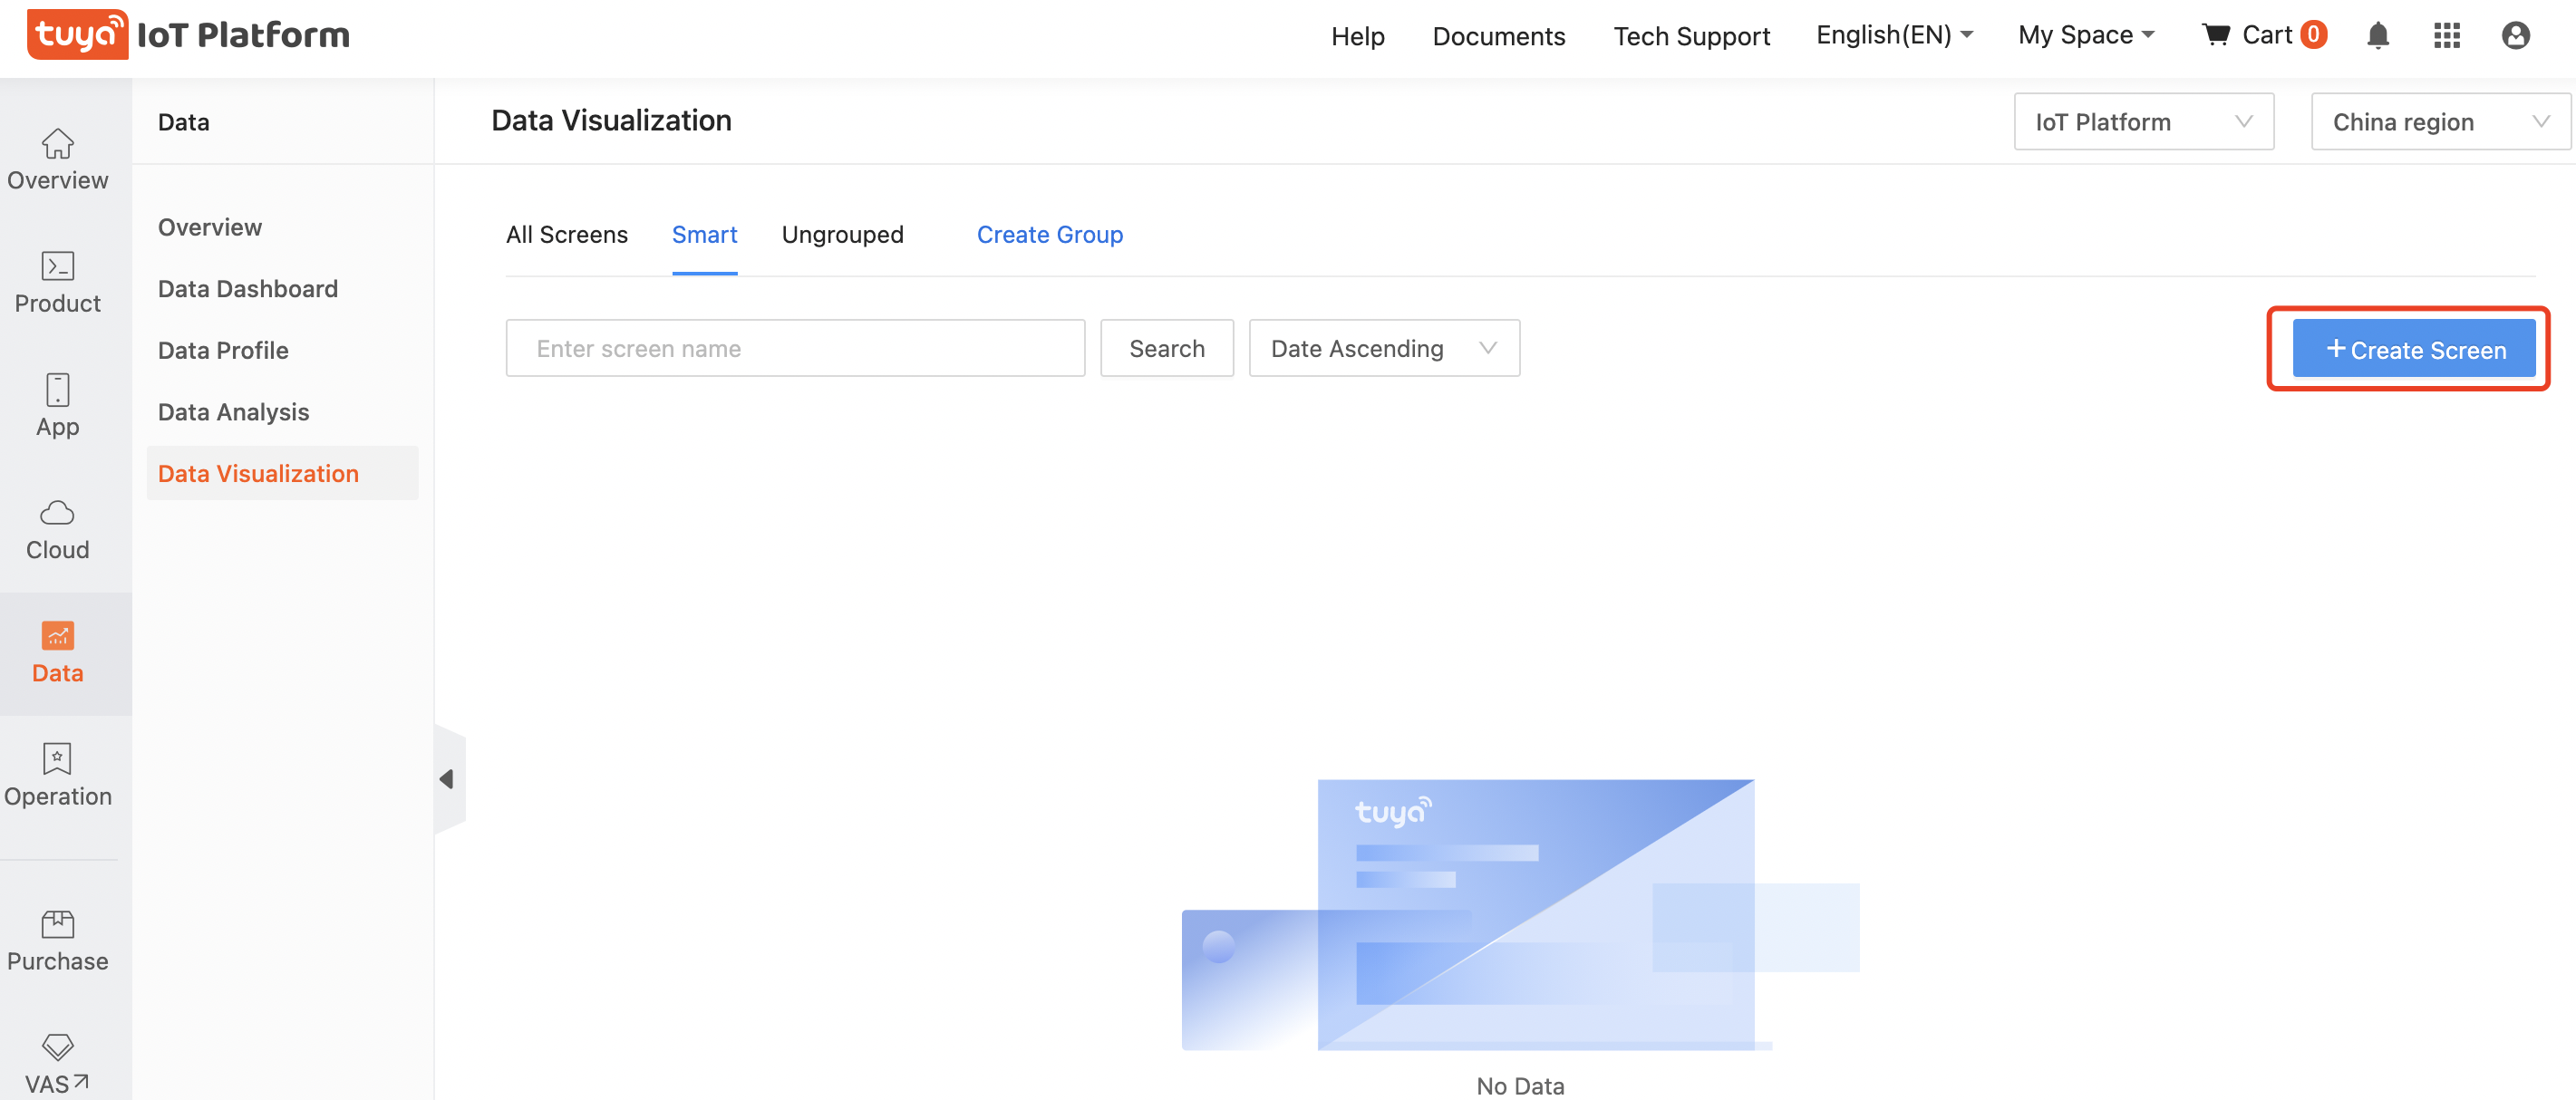
Create a screen
Create a visualization screen based on a template or a blank page in the current group, and then navigate to the editing page.

Add components
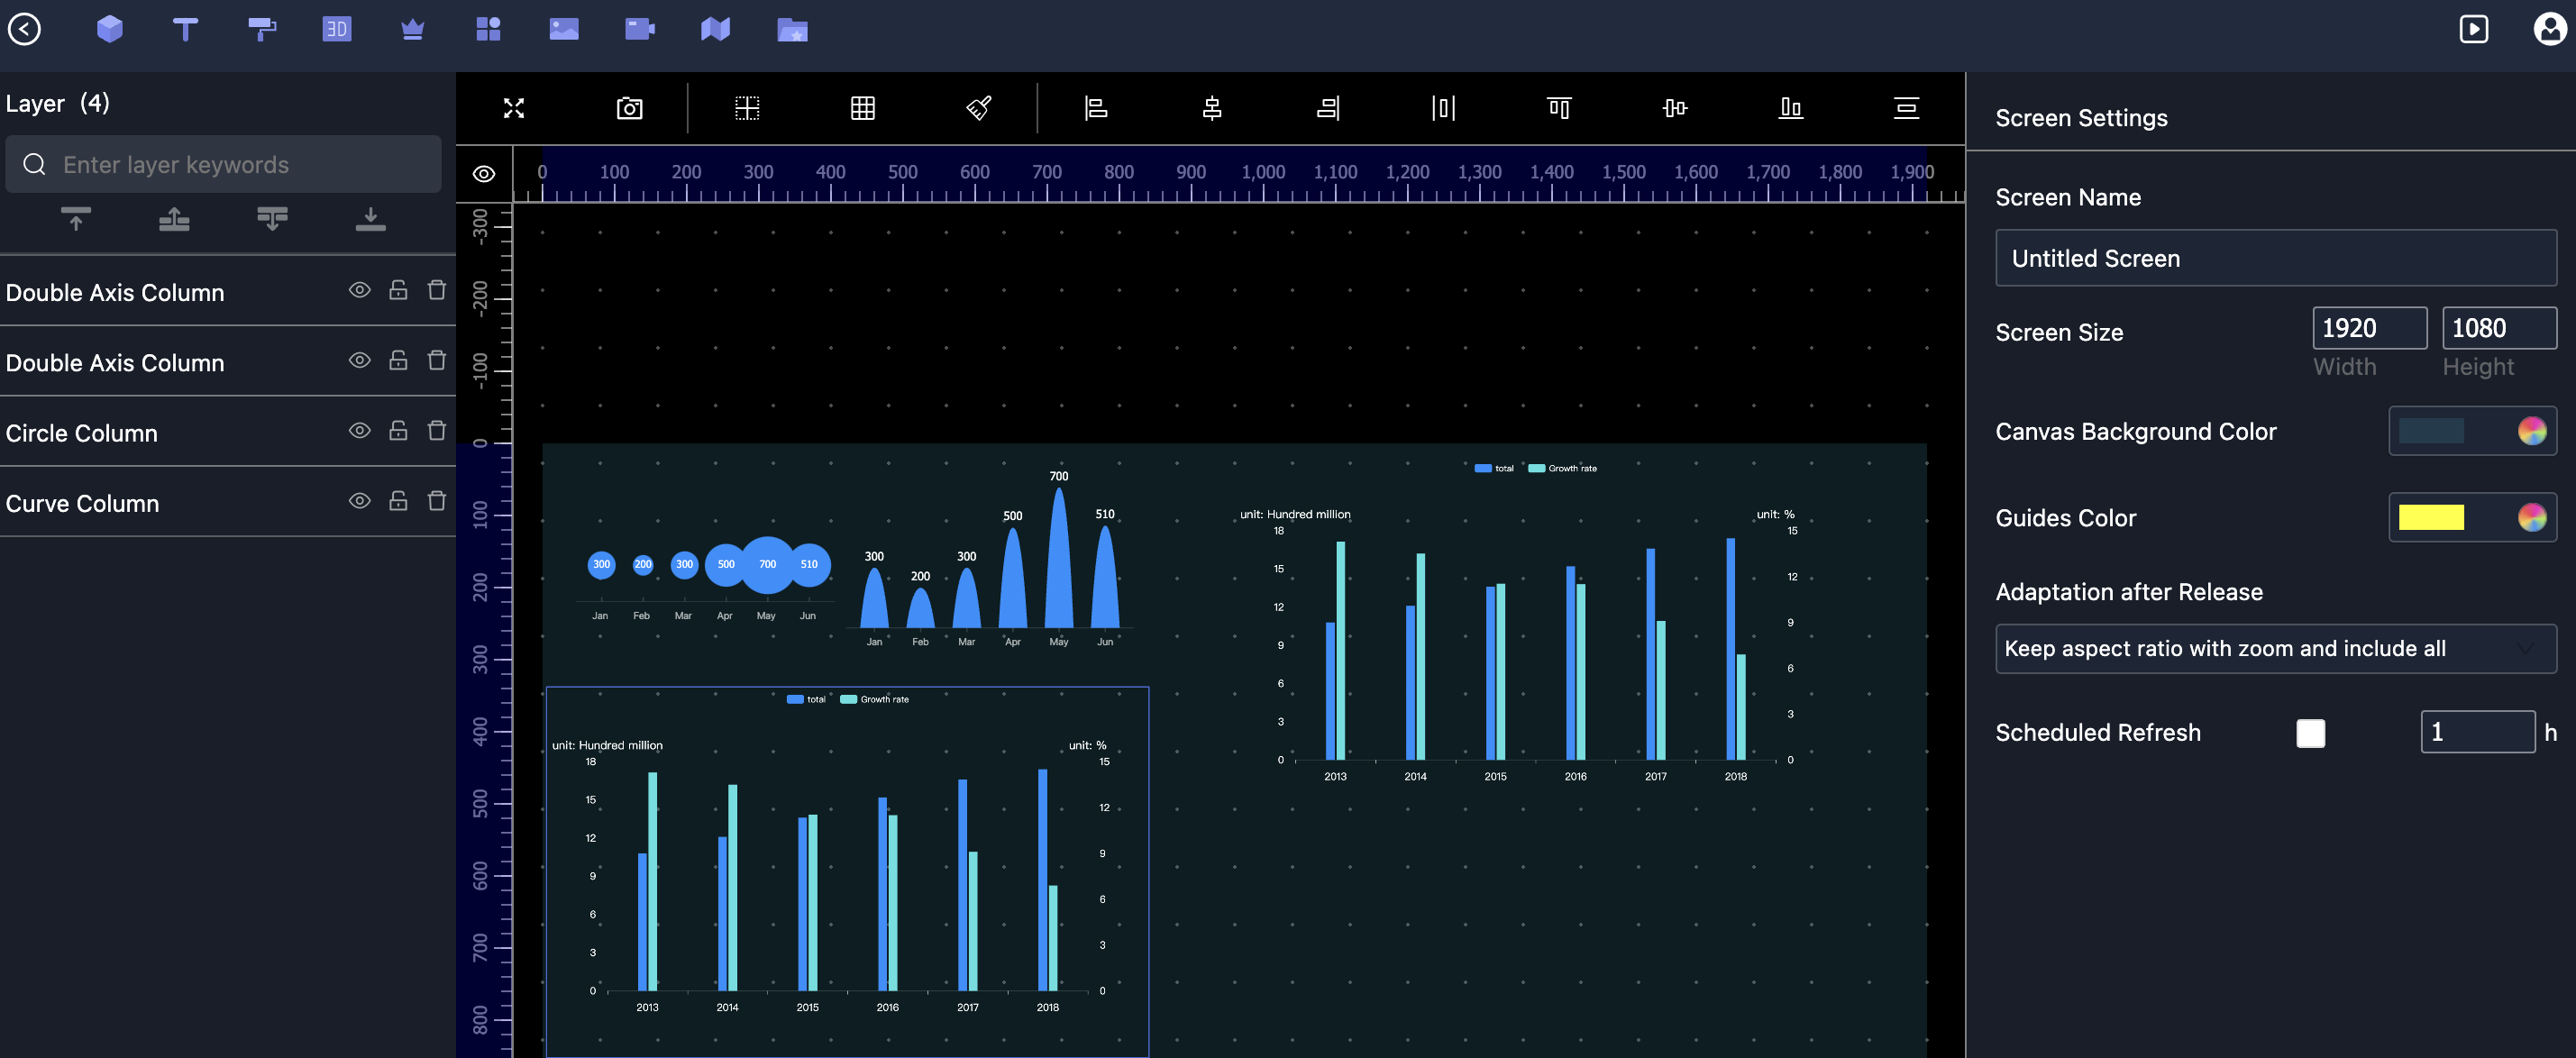
On the editing page, add components to the canvas, and adjust their layers in the layer list.
Configure data source and style
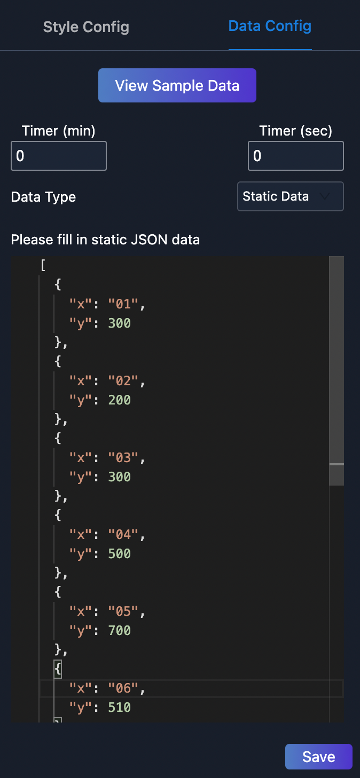
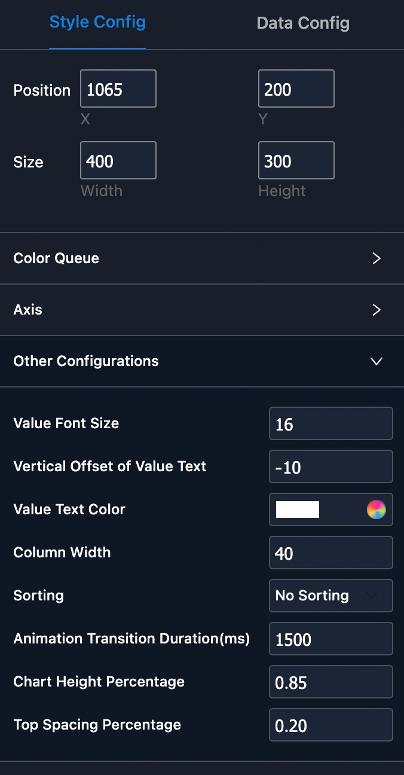
In a single component, add the data source of static JSON data, RestAPI, Atop, Highway, and more. Then, adjust the component style to suit its features.
Release a screen
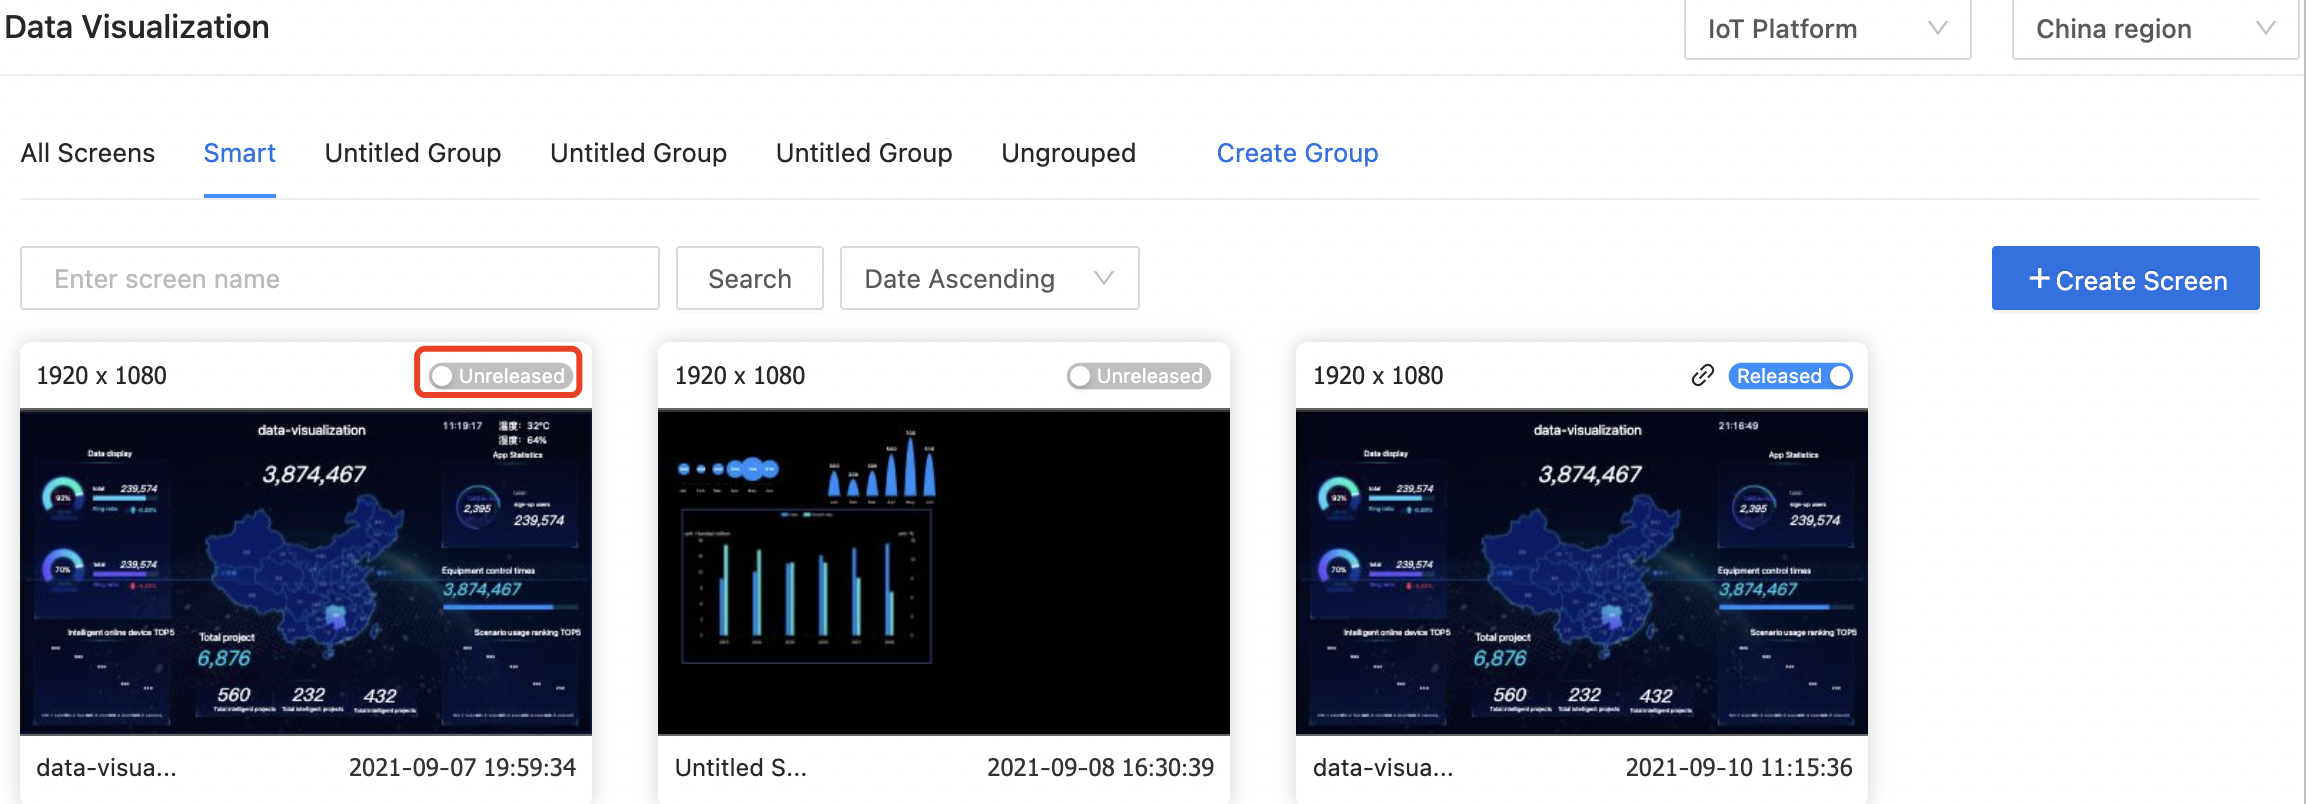
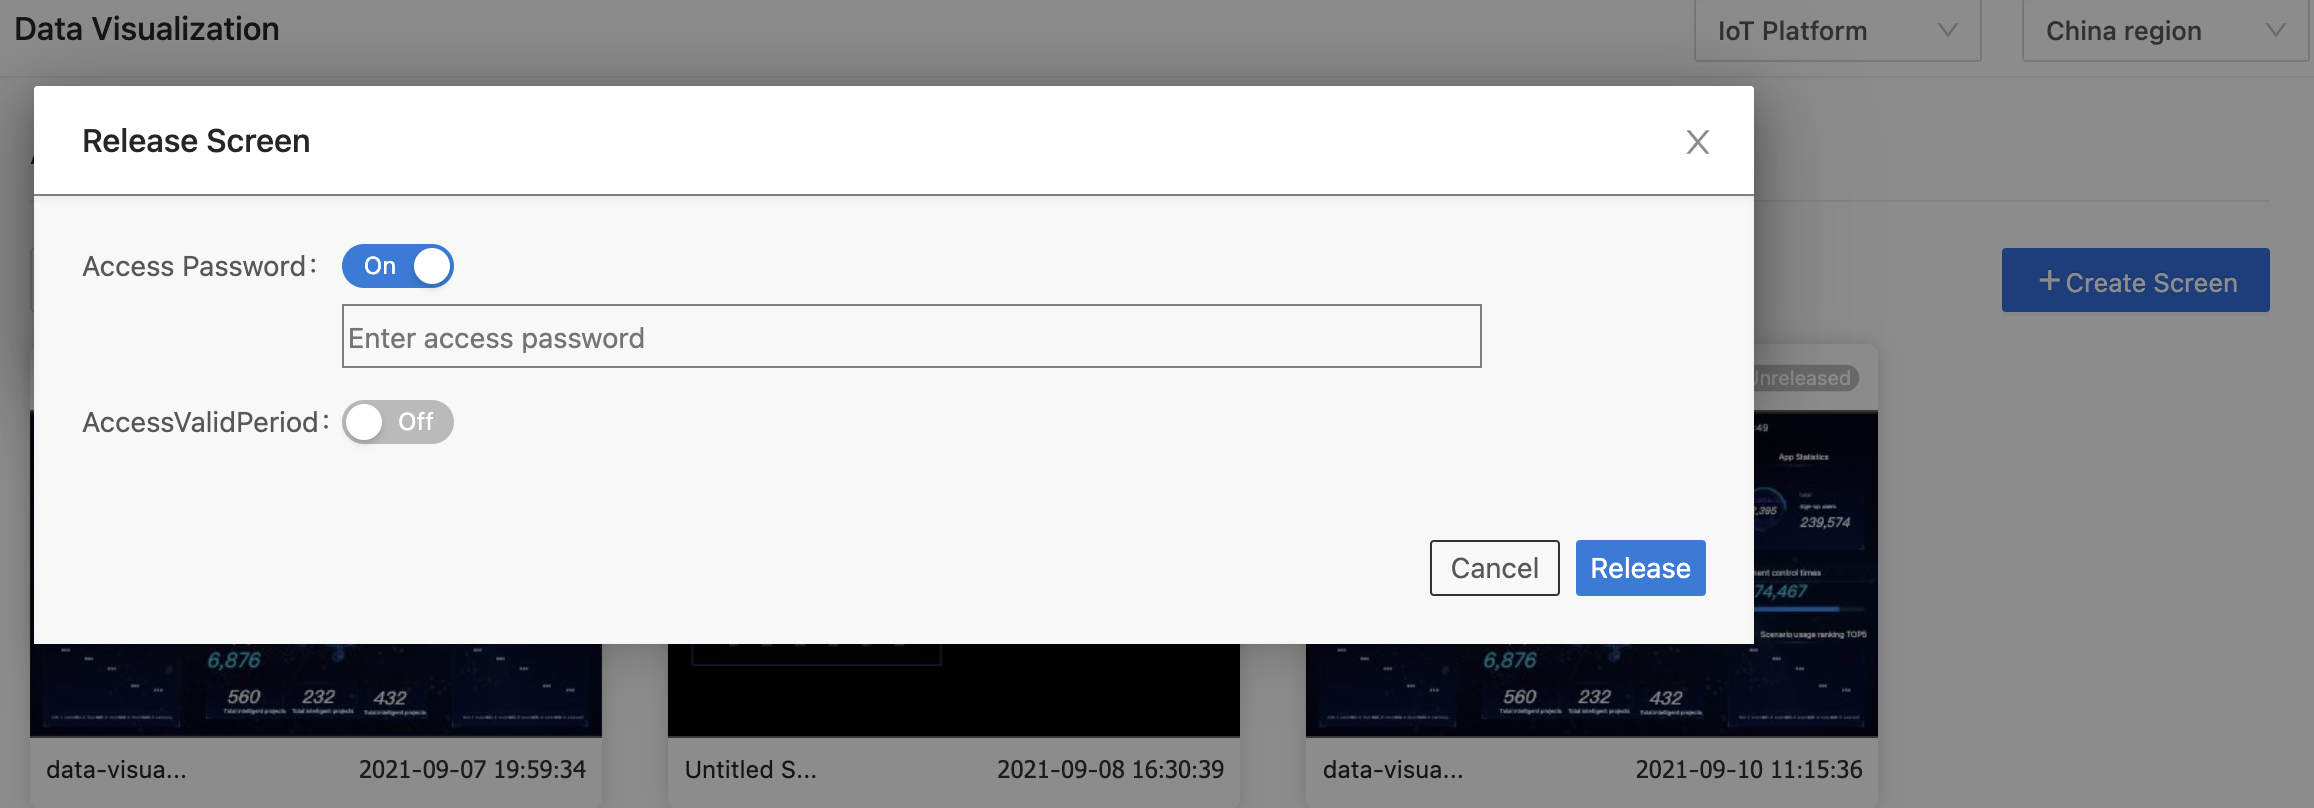
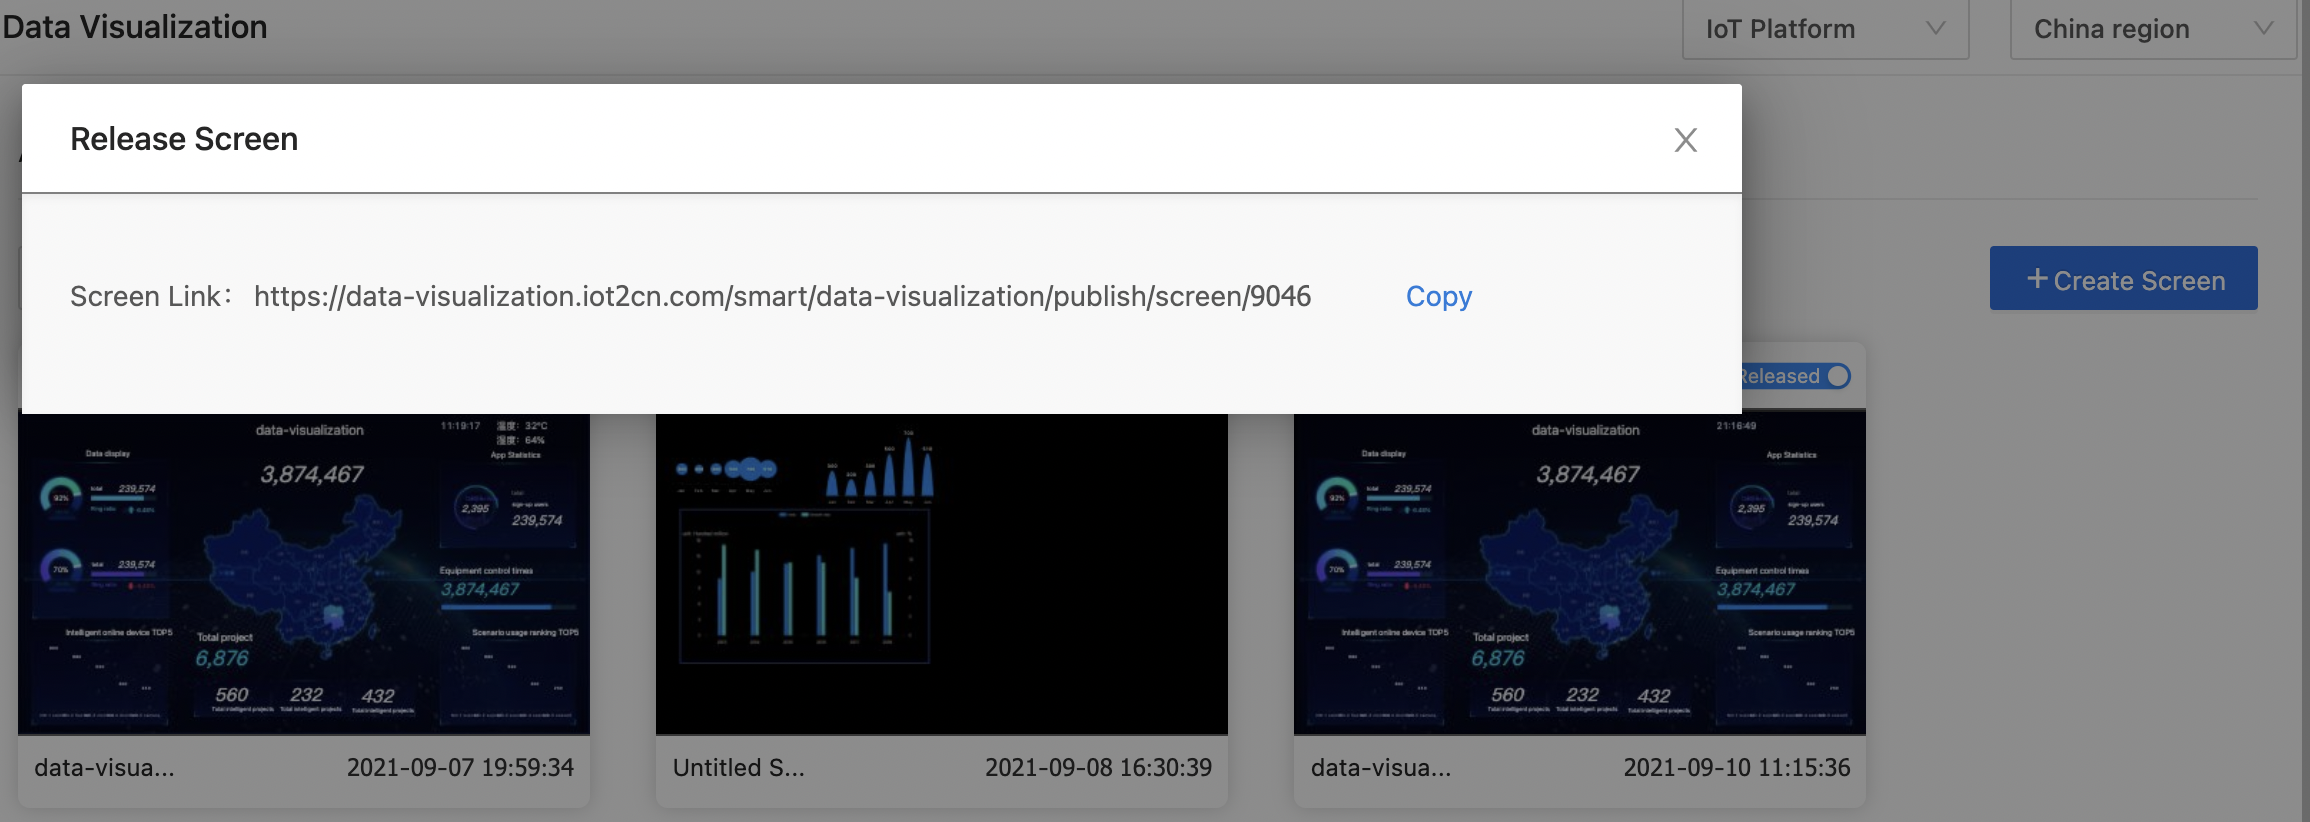
Configure canvas size and adaptation, return to the list page, edit the screen, and then click Release. The system generates a URL for you to view the visualization screen.
Is this page helpful?
YesFeedbackIs this page helpful?
YesFeedback


