Agent Debugging and Preview
The AI Agent Development Platform provides a complete end-to-end online debugging and real-time preview solution to address the "black-box" challenge in agent development and operations. After completing AI agent orchestration, debug it online and preview it in the MiniApp. You can verify logic, simulate scenarios, and preview the agent directly on the platform without deployment. This enables rapid iteration and high-quality delivery.
Overview
Online debugging provides you end-to-end visibility into the agent workflow, from user input to model response. You can view detailed information about model invocations, workflows, tools, and knowledge base calls at each stage to pinpoint issues and tune agent settings.
You can also simulate real-world conversations by binding a virtual device ID, or by linking an app account with home information. This helps you identify and fix logic issues related to specific device states, user attributes, or home scenarios before deployment, greatly reducing the risk of production incidents.
Terms
Online debugging uses the same data structure as operational logs. For more information, see Agent Runtime Logs > Terms.
| Term | Definition |
|---|---|
Stage |
A stage is a task-type unit within a conversation round, covering the process from user input to robot output. It describes the complete processing pipeline of an agent request. For example, in a voice interaction scenario, stages include automatic speech recognition (ASR) → large language model (LLM) processing → text-to-speech (TTS). |
| Node | A node is the smallest operation unit executed by an agent within a stage. Examples include invoking an LLM, executing a tool function, reading from a knowledge base, or accessing a memory variable. Node-level visibility provides fine-grained performance analysis and logic tracing capabilities, enabling "white-box debugging". |
Debugging types
The platform supports two debugging modes: online dialogue debugging and QR code MiniApp debugging. You can switch between these modes on the agent orchestration page. Bind virtual devices or grant access to home data to simulate device conversations, MiniApp panel interactions, and end-user experience.
The online debugging view supports debugging log playback for up to the past seven days.
Online debugging
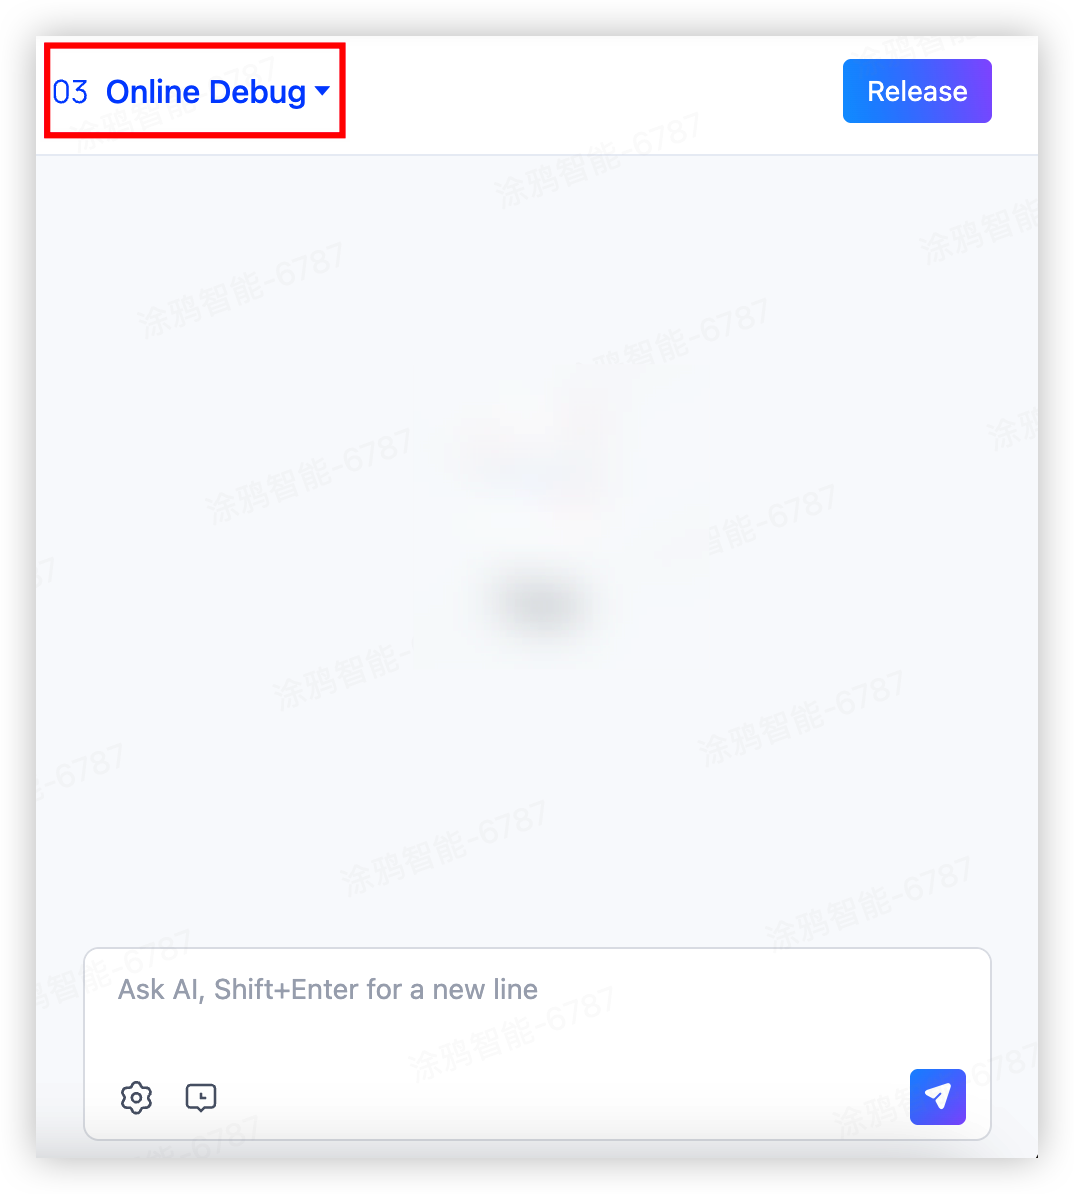
Select Online Debug in the upper left corner of the page to perform real-time conversation tests and instant trace analysis.
QR code debugging
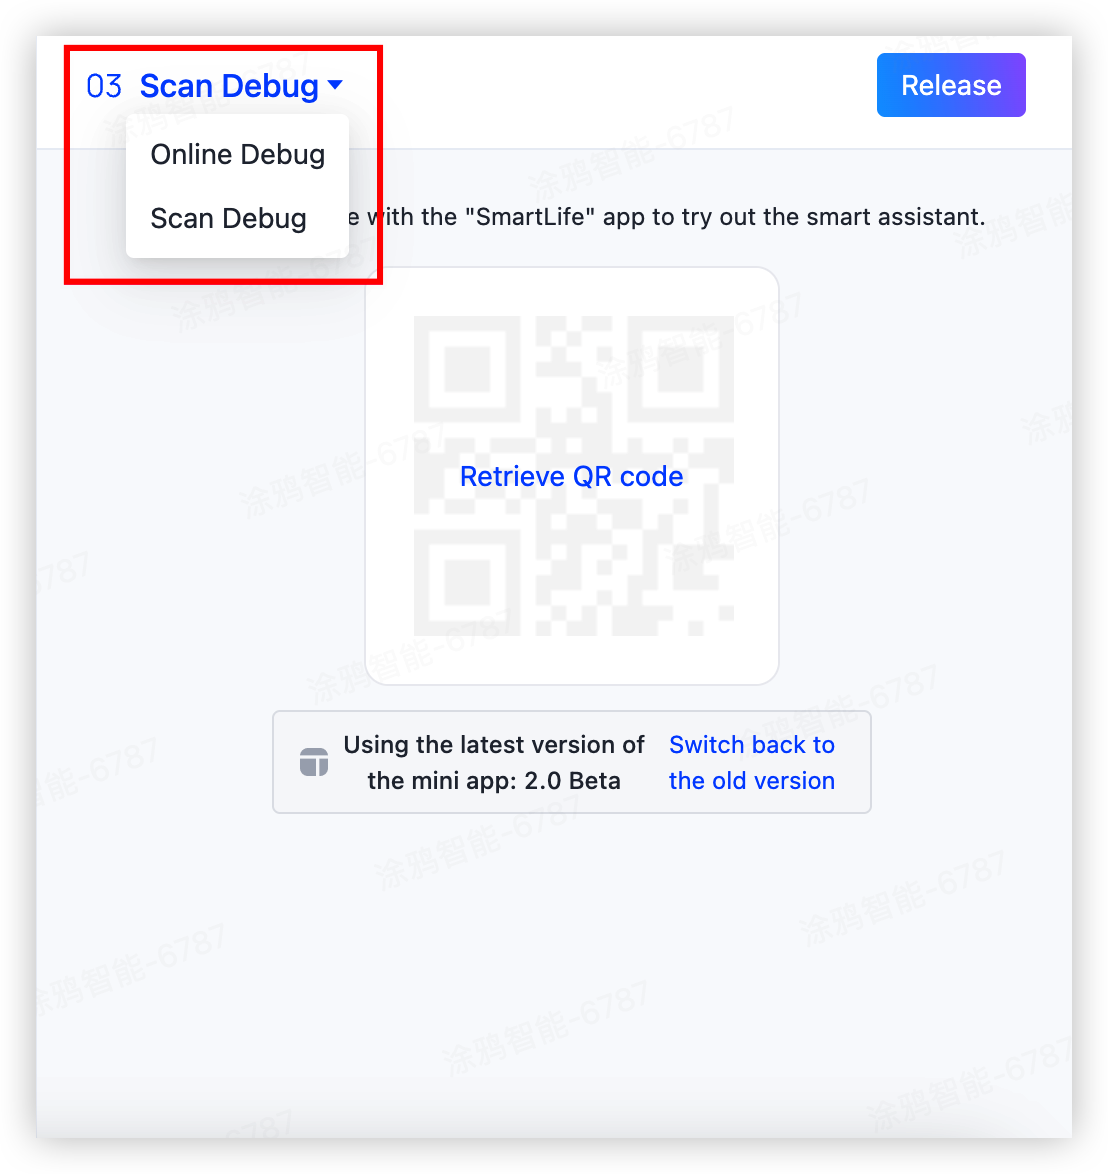
Select Scan Debug in the upper left corner of the page to enter the debugging configuration page. You can scan the generated QR code using the SmartLife app to preview MiniApp conversations. You can also preview the conversation by deploying to a device product ID (PID) or an OEM app.
Online debugging
Online debugging displays the complete execution trace of each conversation round, including:
- Session information
- Device and user information
- Invocation flow of nodes
- Node status and execution duration
- Node inputs and outputs
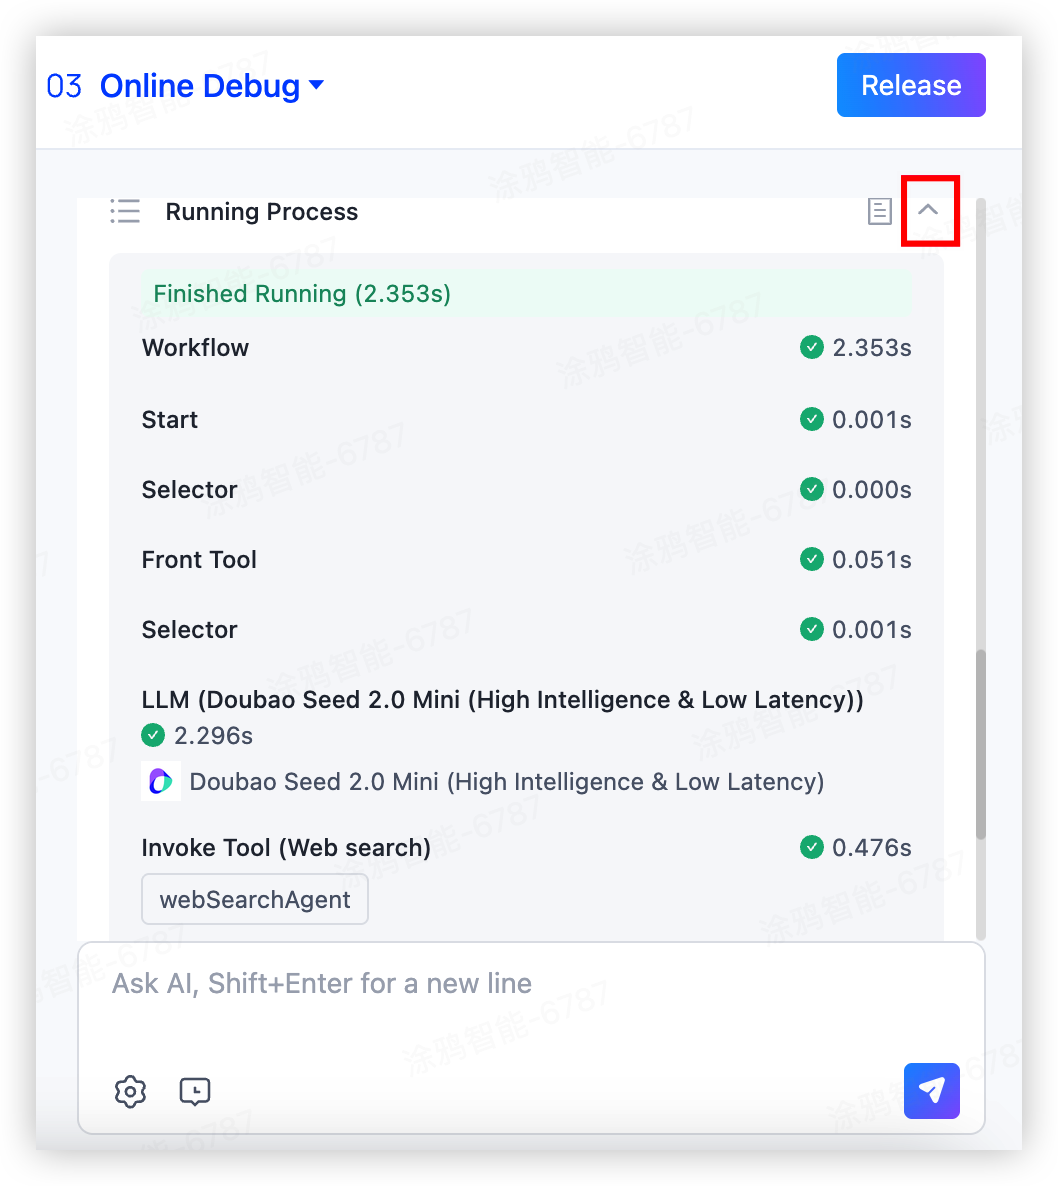
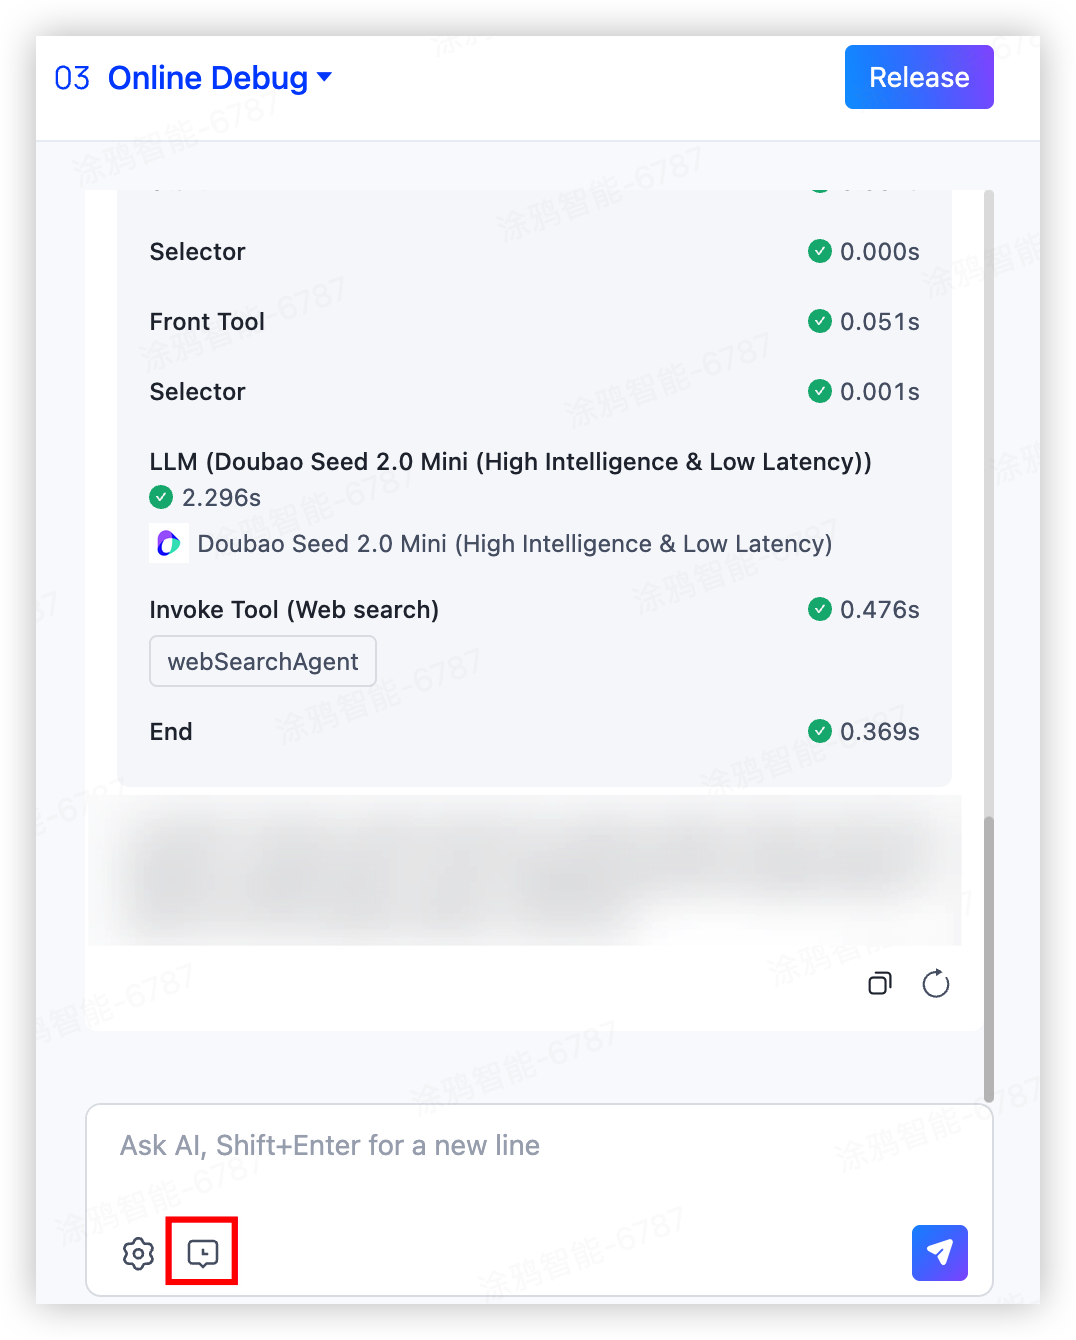
View quick preview
Click the expand icon in the upper right corner of a conversation round to view the execution flow of all key nodes. You can inspect:
- Model invocations
- Skill invocations
- Variable references
- Knowledge base retrievals
- Database read/write operations
View debugging details
Click the details icon in the upper right corner of a conversation round to view detailed debugging logs for that conversation.
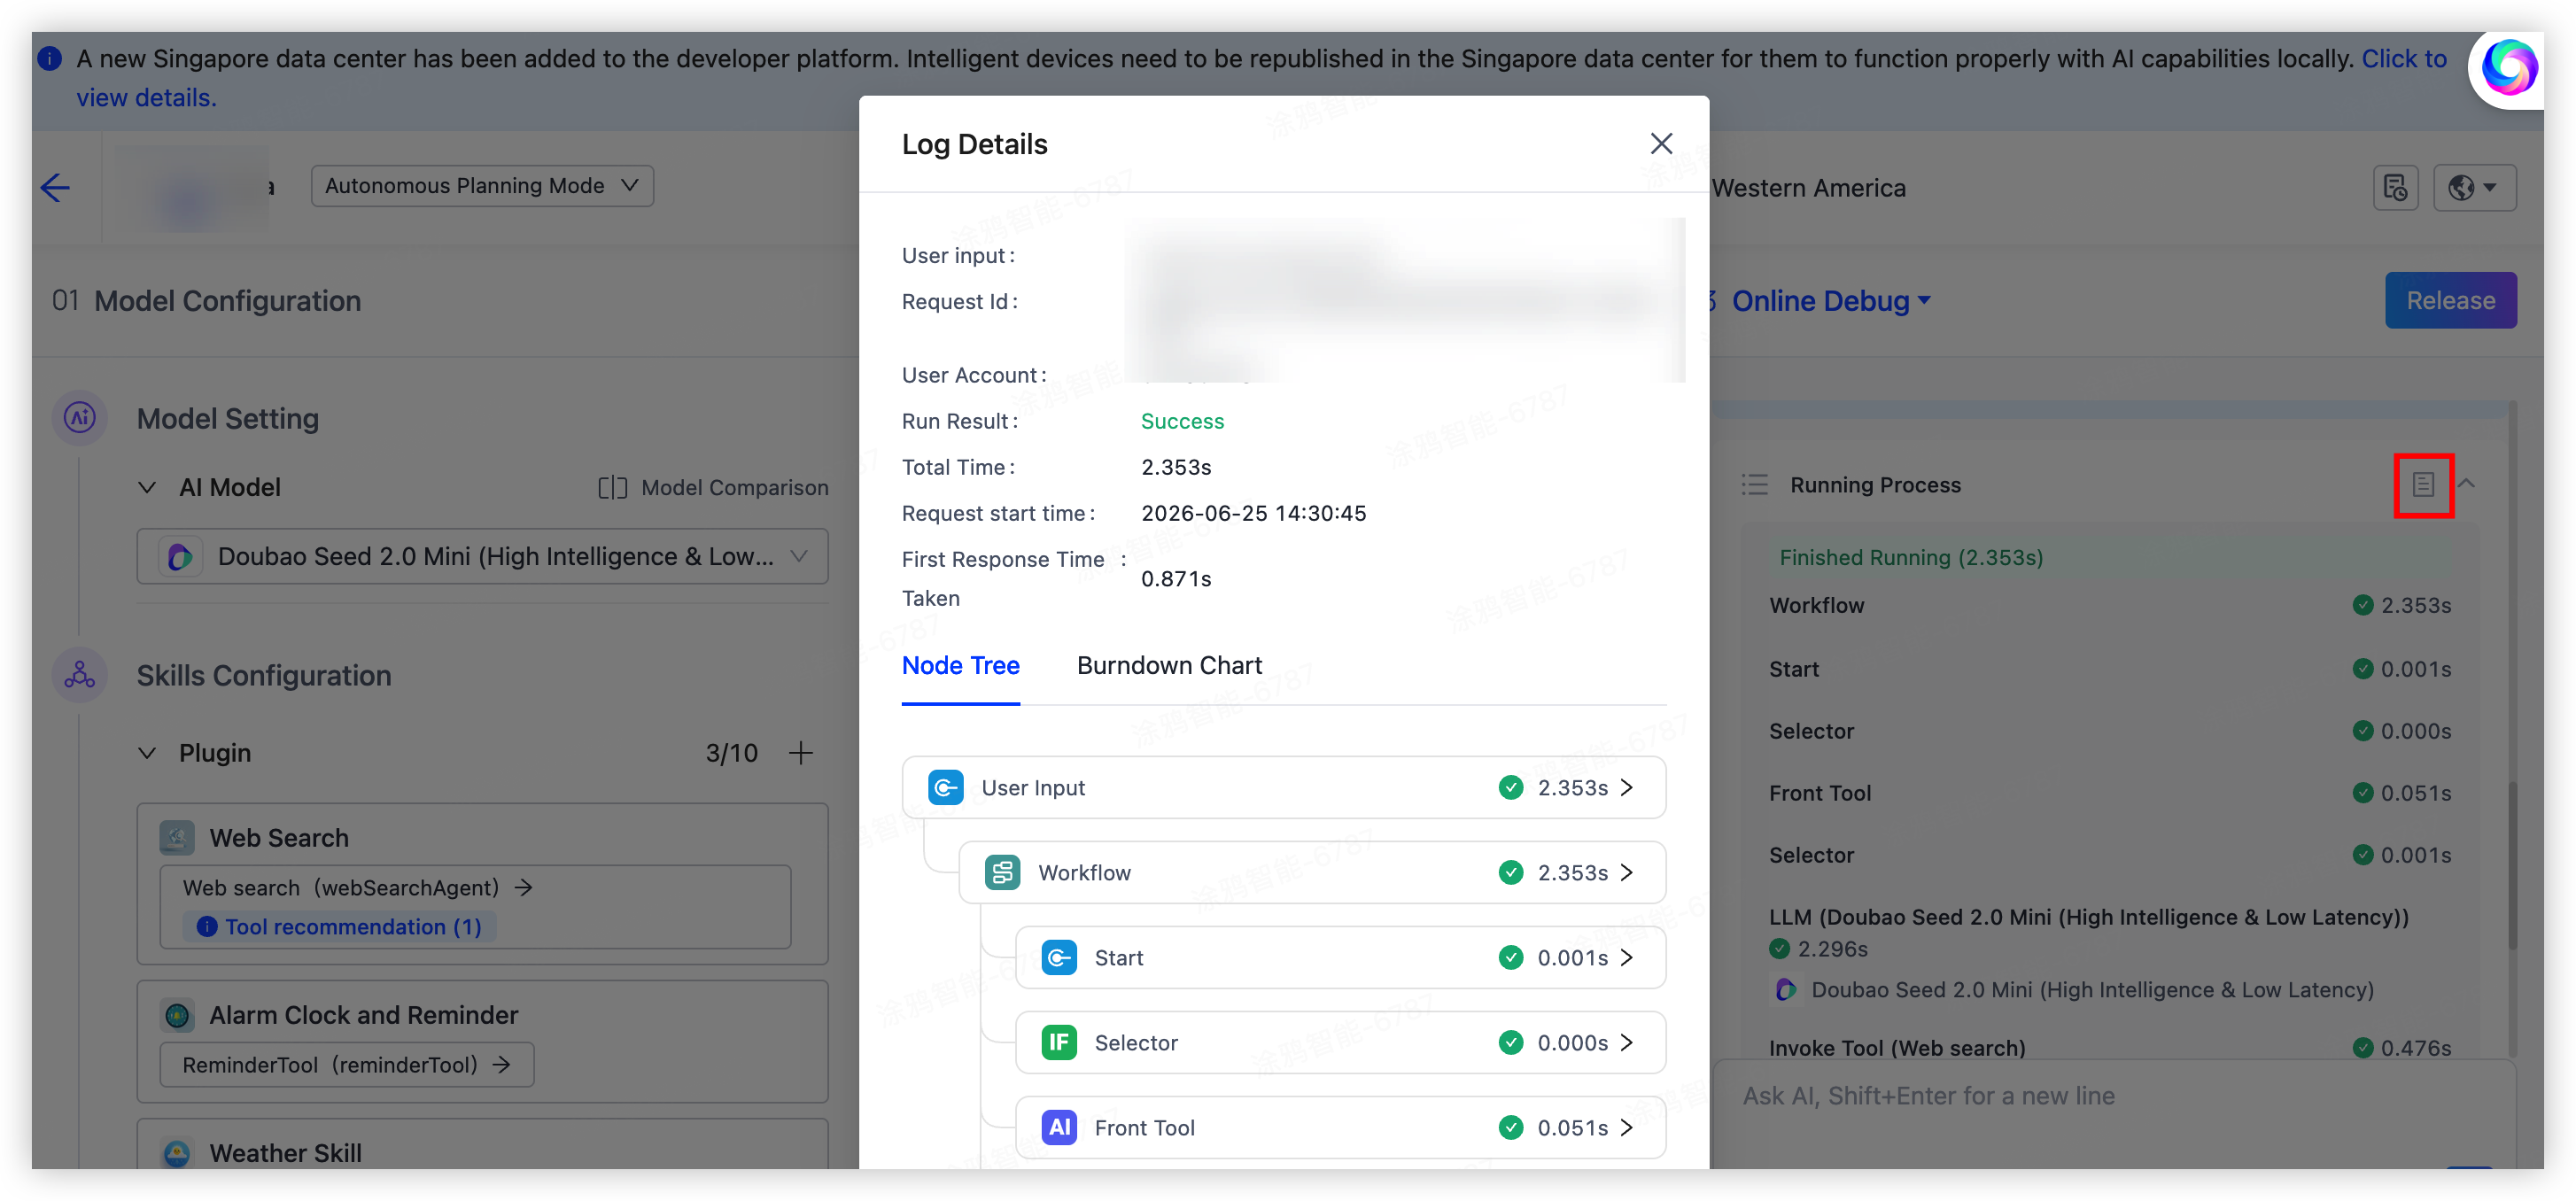
Debugging log information
Basic information
Basic information for each conversation round includes the Request ID, start time, duration, device ID, and user account.
| Field | Description |
|---|---|
RequestID |
The request ID of the current conversation round. |
| Device ID | The device ID where the agent runs. |
| User account | The user account of the current conversation round. |
| Execution result | The execution result of the current conversation round. |
| Total duration | The total time consumed from input to output. |
| Request start time | The time when the current conversation round is initiated. |
| Time to first token (TTFT) | The elapsed time from request to first token. |
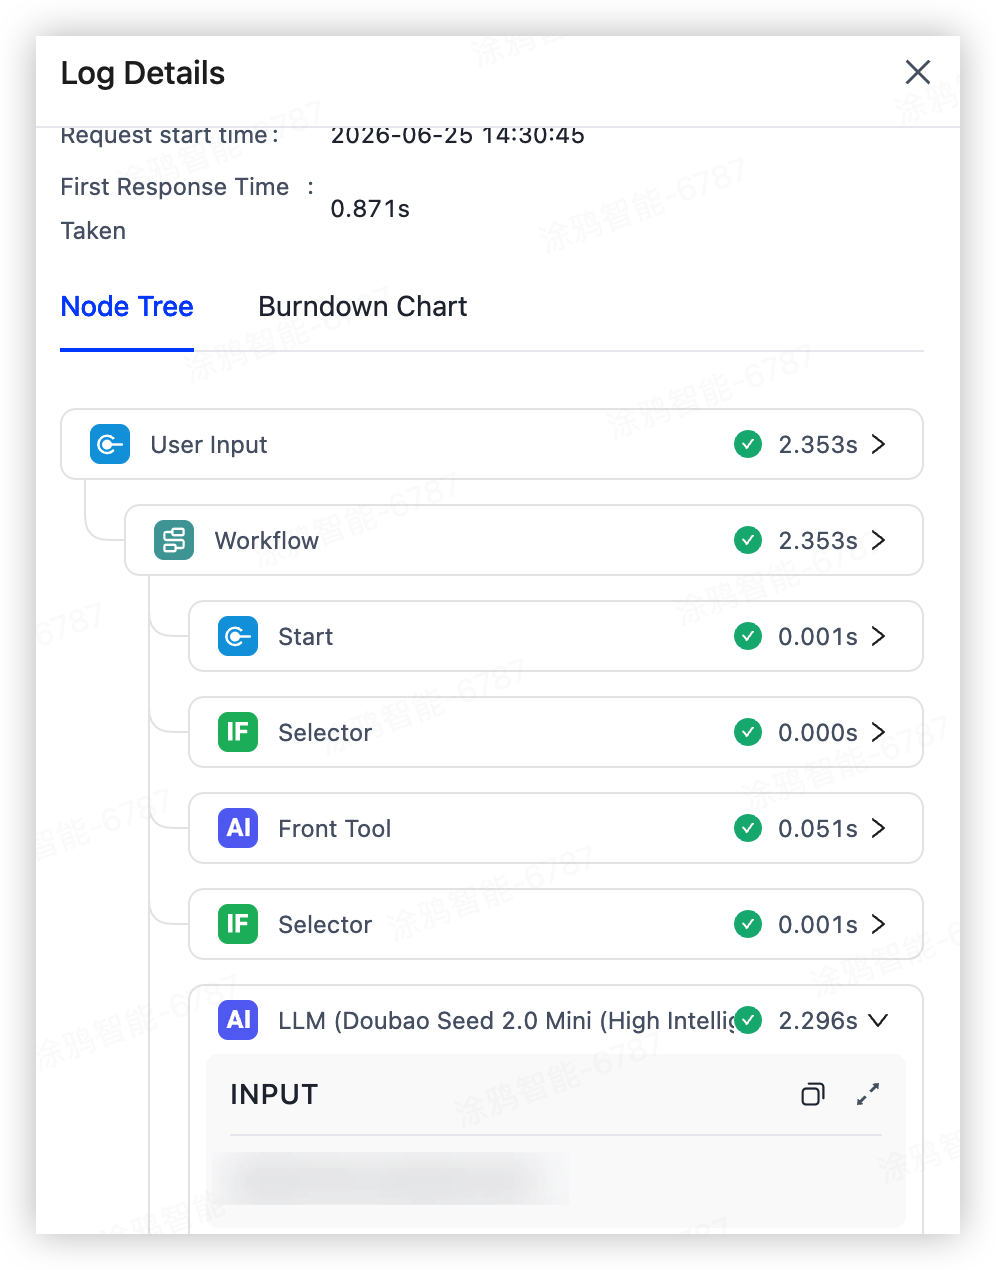
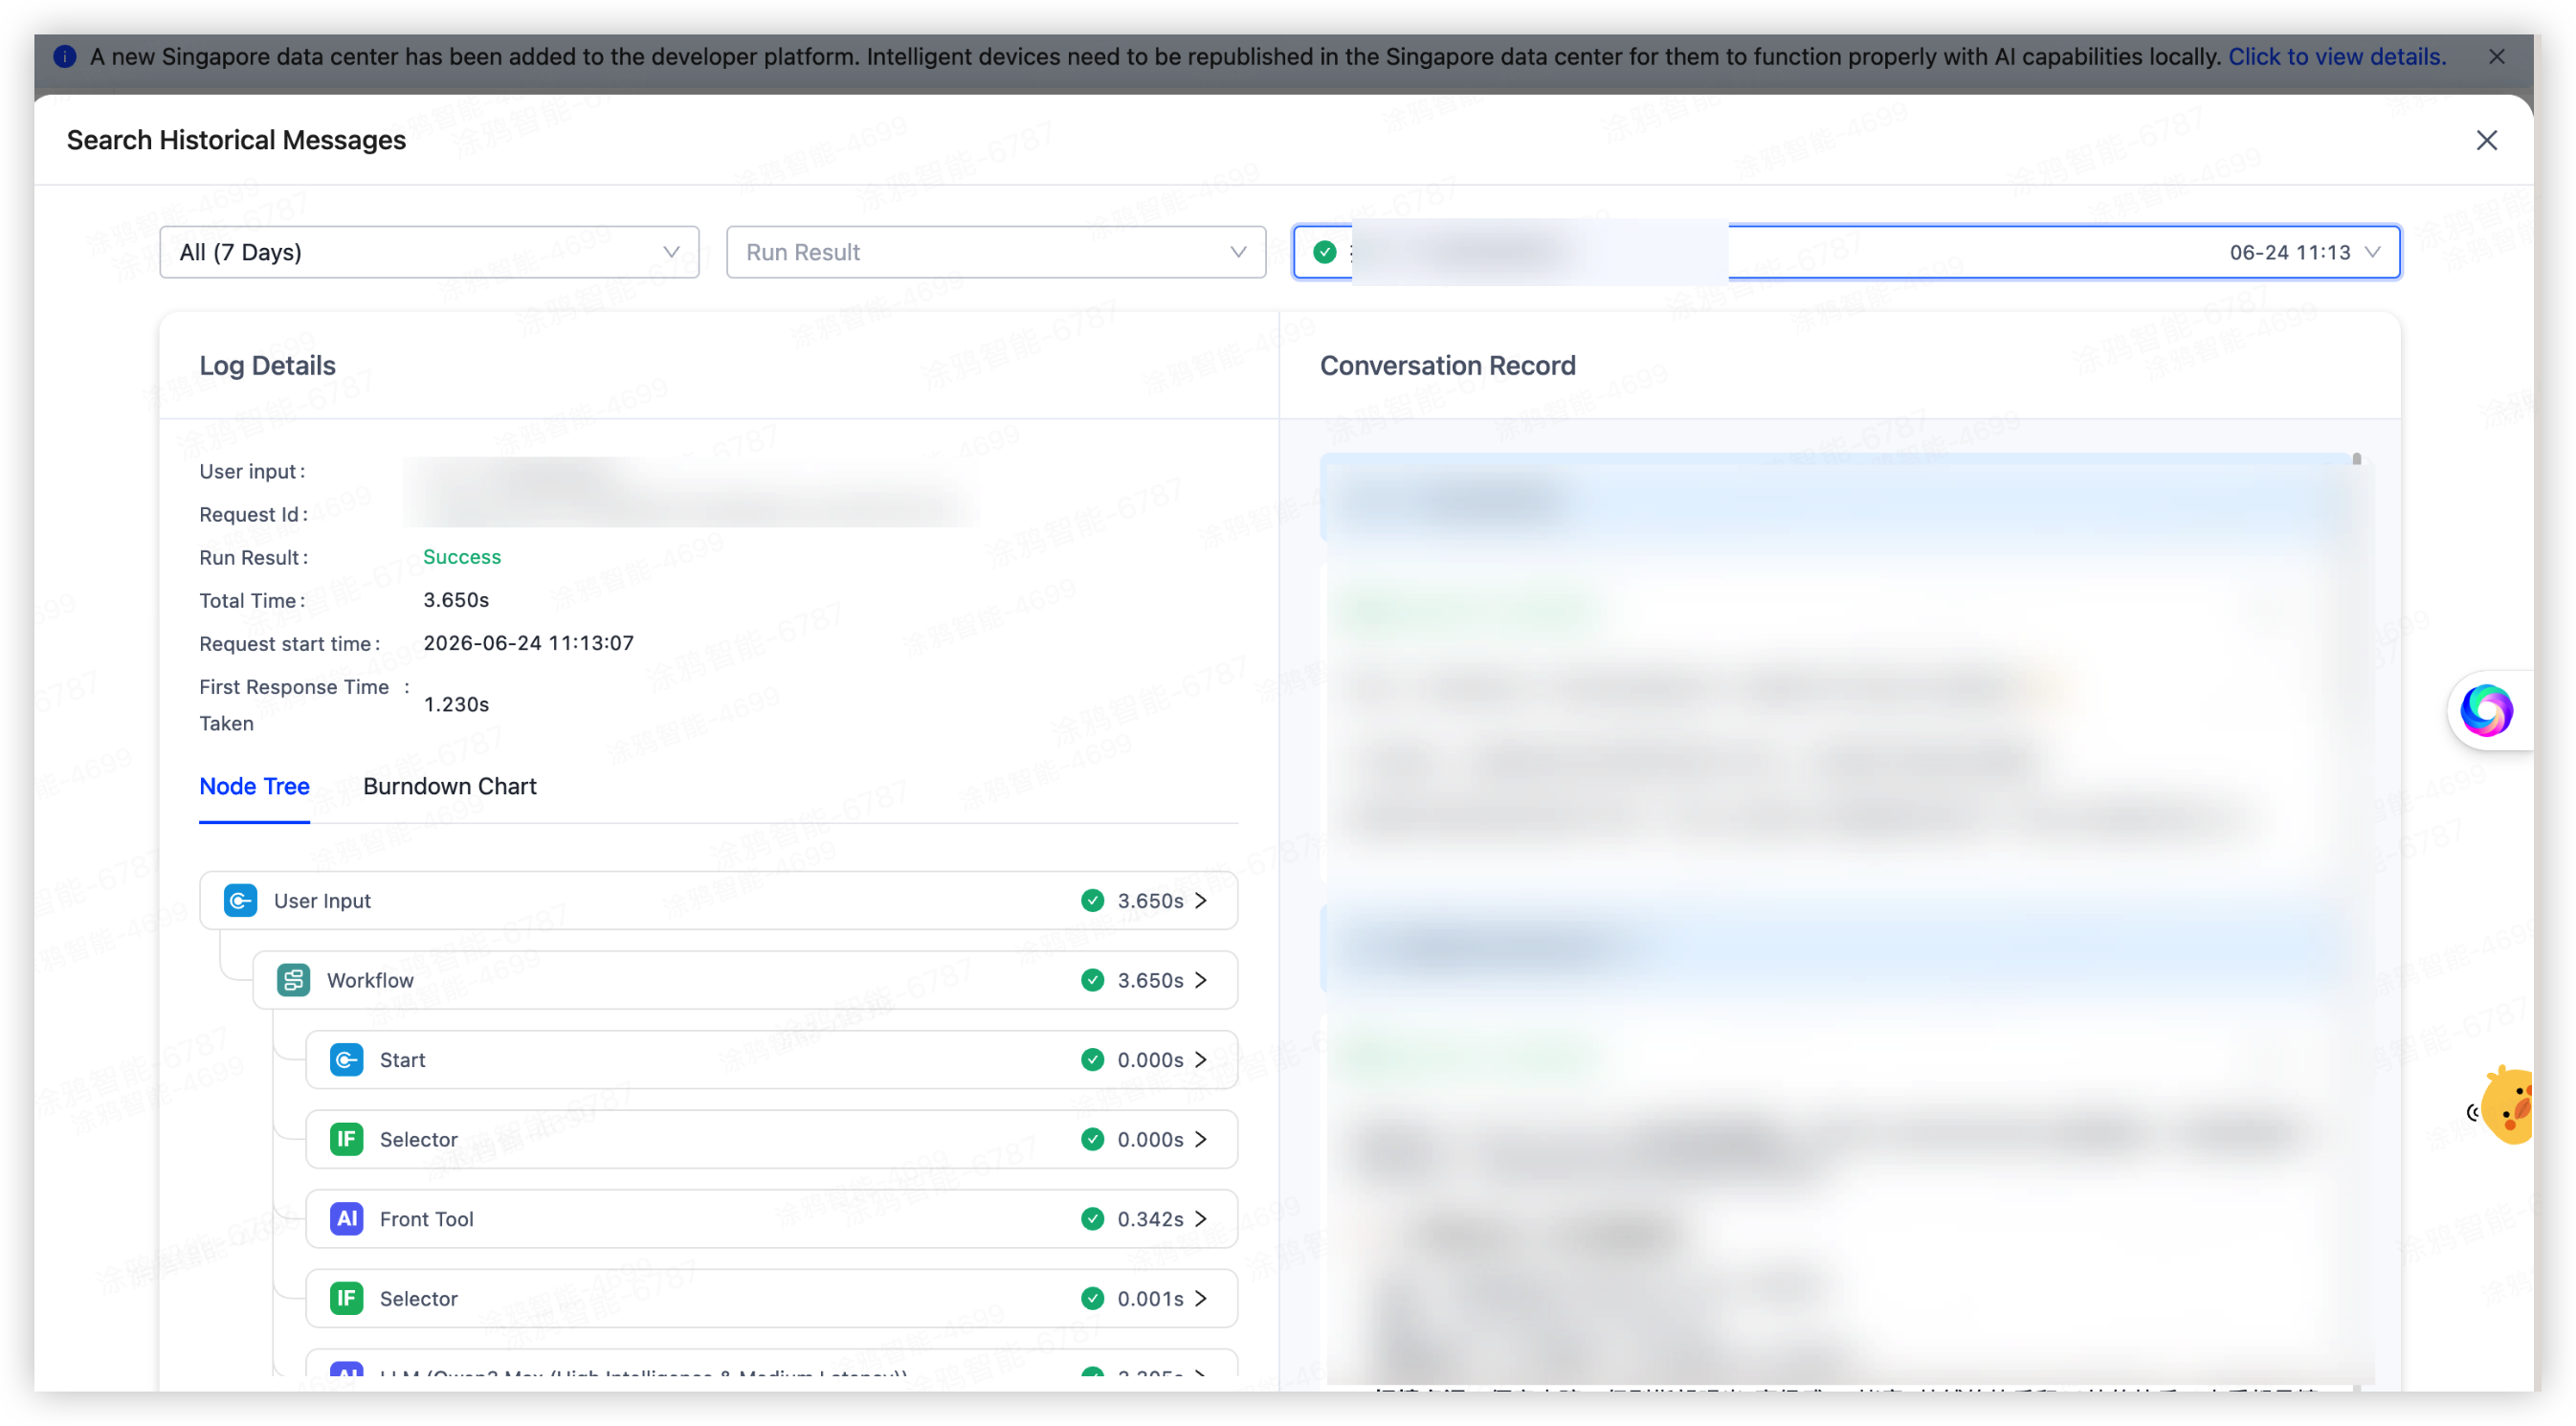
Node tree
The node tree visually displays the complete trace, including node topology, execution details, inputs, outputs, and execution duration.
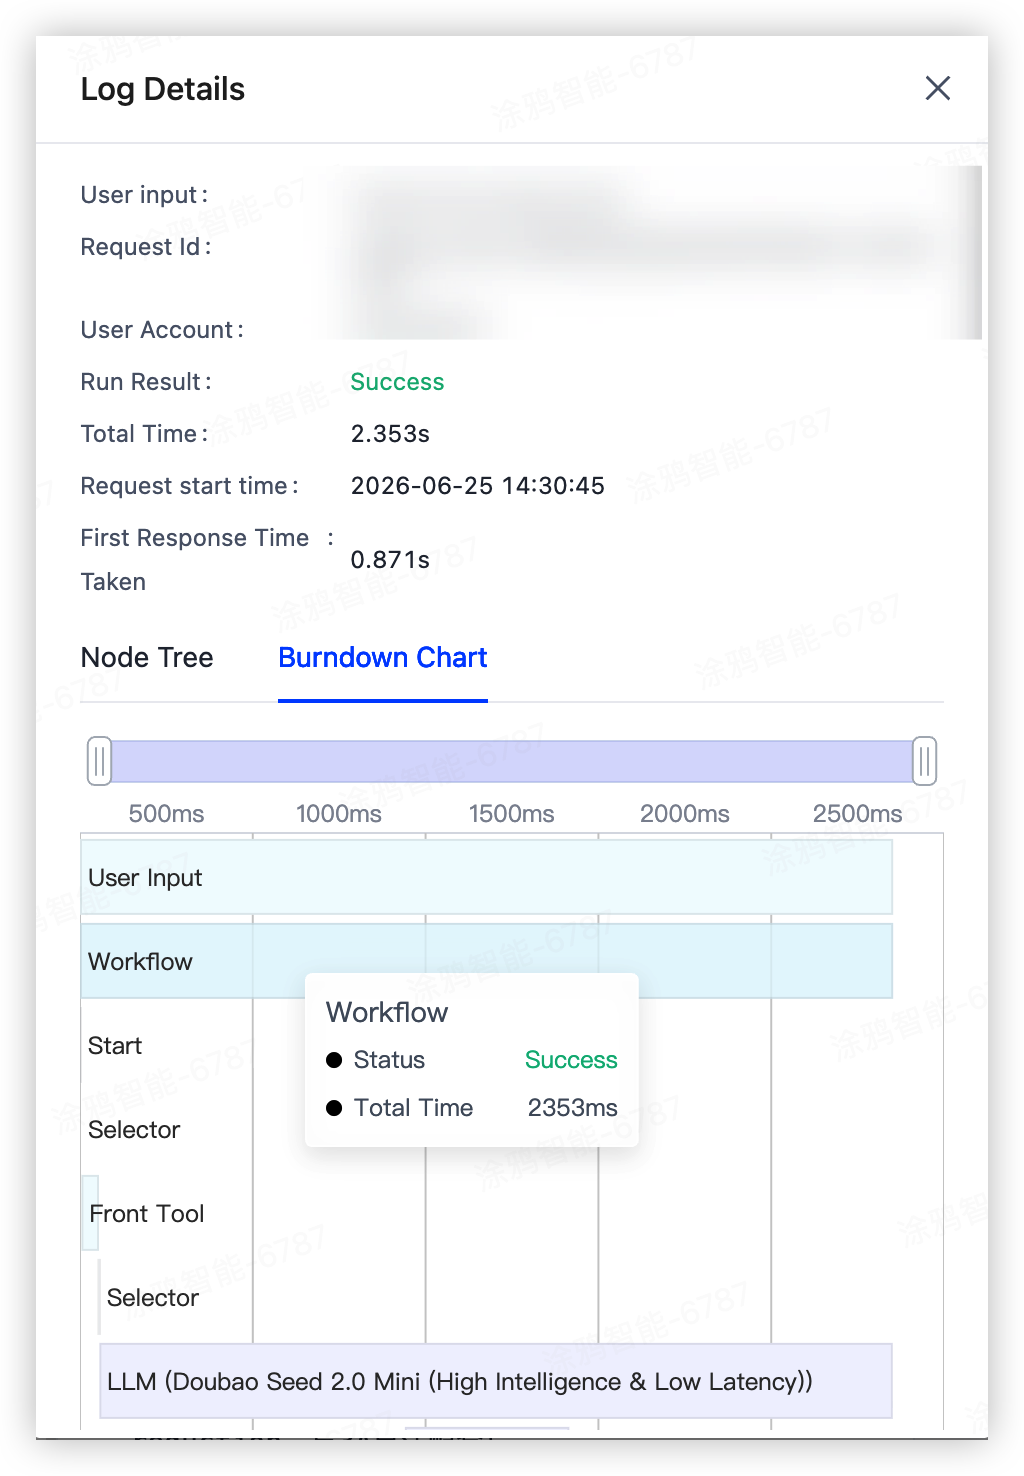
Burndown chart
The burndown chart displays duration distribution across the full trace and individual nodes, helping you analyze and optimize response performance.
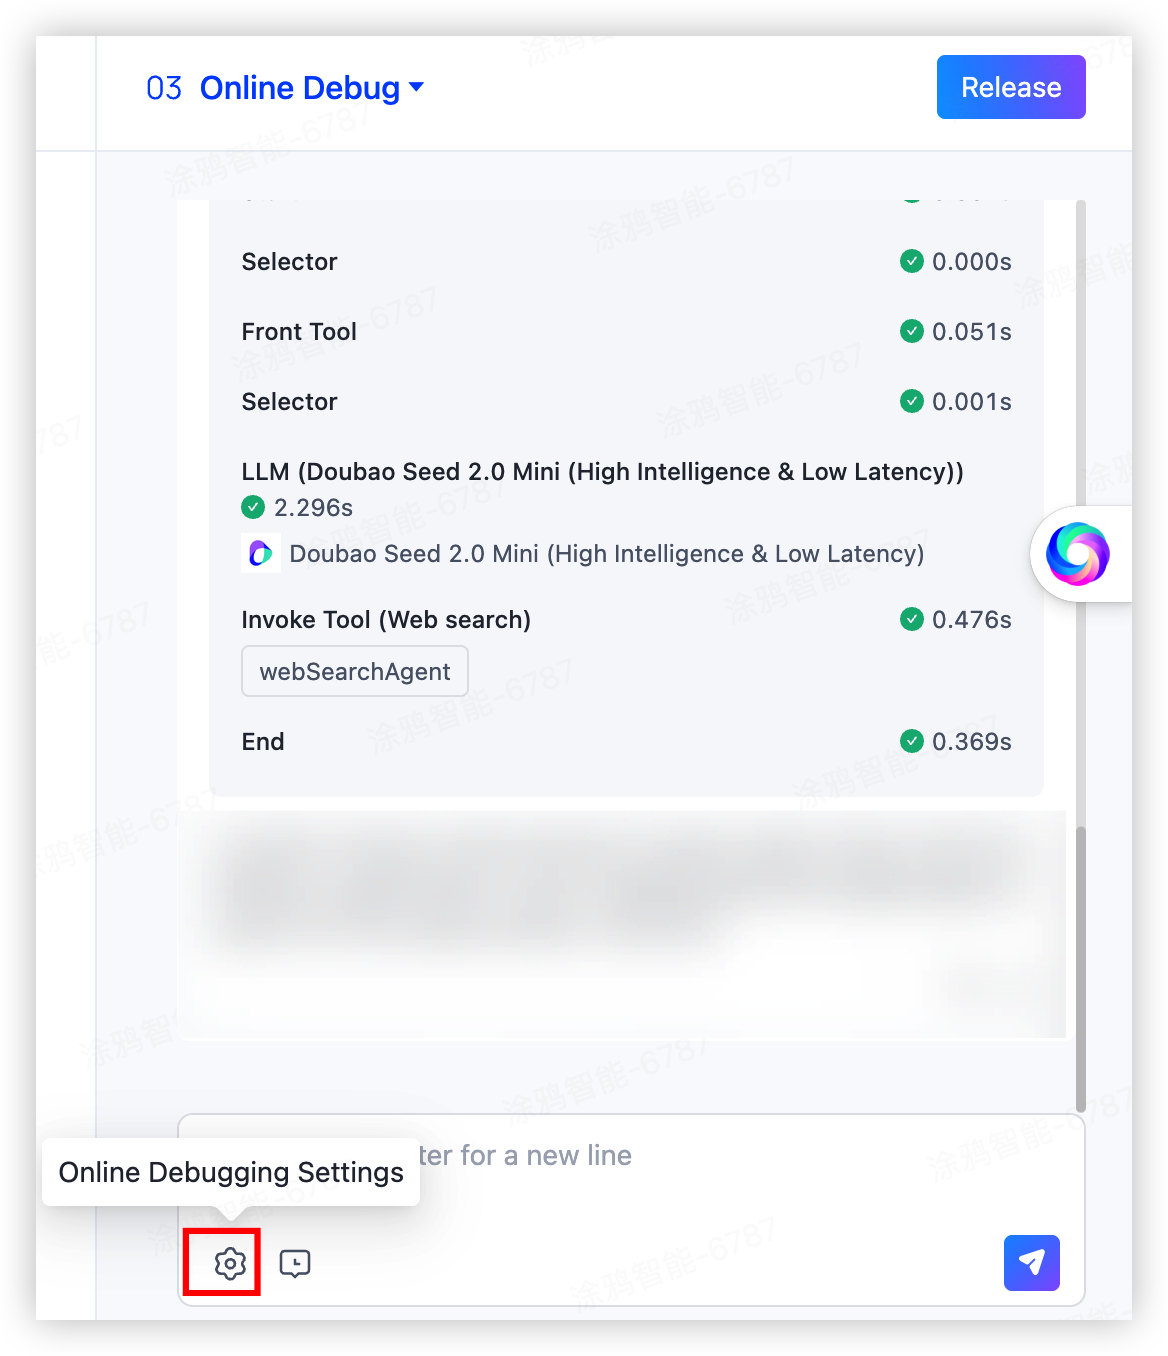
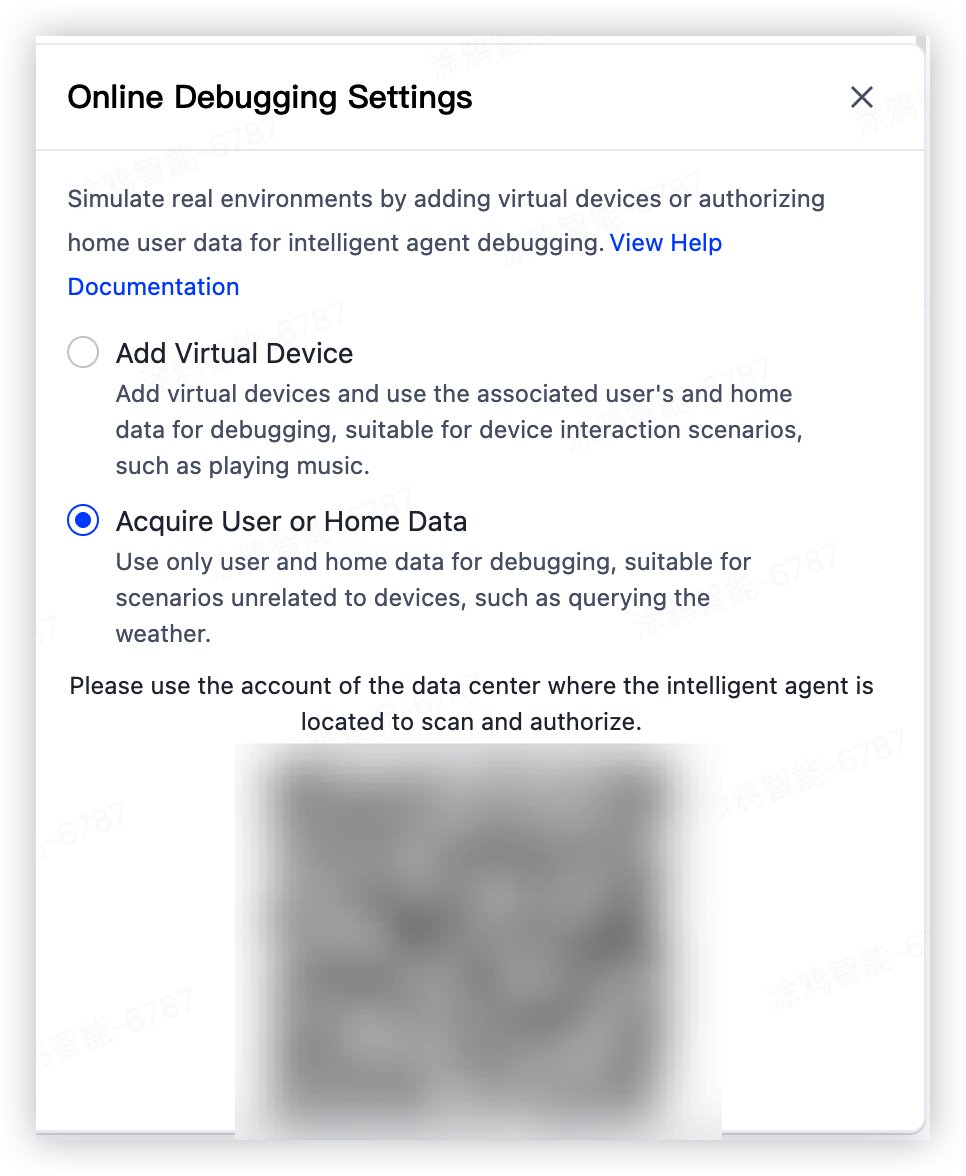
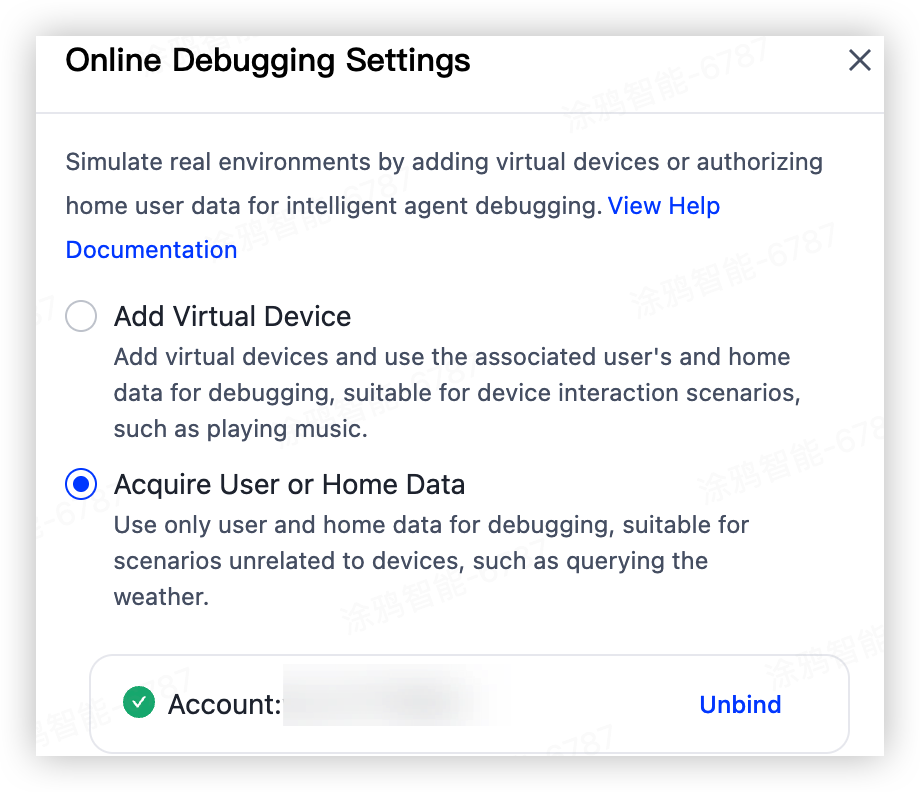
Debugging settings
Click the settings icon in the debugging panel to configure virtual devices and bind real app user profiles to simulate production-like scenarios.
Bind a virtual device
After you bind a virtual device, you can simulate the conversation with the agent in a real device scenario. Use this to test device control and status queries without physical hardware.
For example, to test music playback, bind a virtual device and enter the command "Play songs by Jay Chou" in the dialog box. The debugging panel displays the agent’s response as if it were interacting with a real device. Because no physical device is involved, no actual playback occurs. Use the agent response and logs to verify playback behavior and inspect device replies.
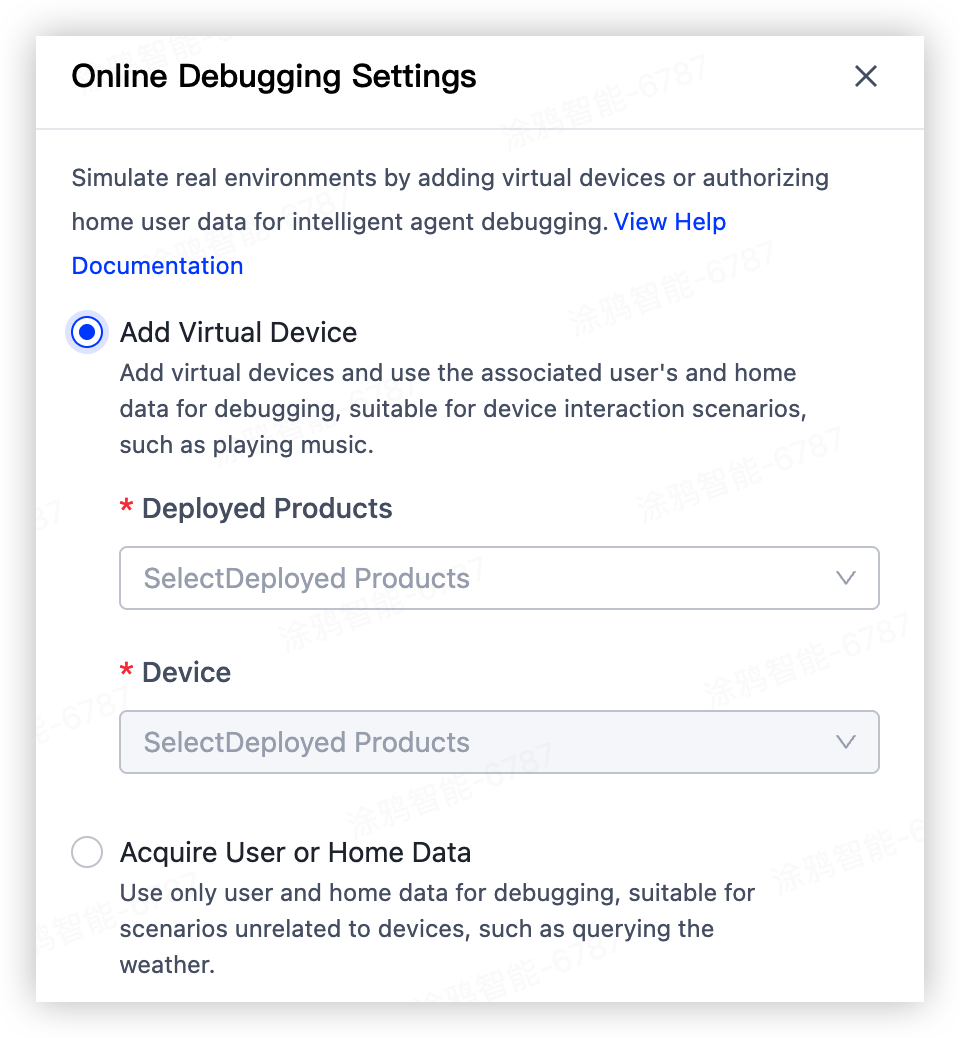

Bind home and user data
After you bind home and user data, the agent responds based on the bound user and home information. This is particularly useful for device-independent scenarios. For example, if you test "How is the weather today?", the agent can return accurate weather information based on the bound home location. This speeds up testing of weather-related skills.
Search debugging logs
By default, you can review debugging logs from the past 7 days. Click the search icon in the online debugging input box to open the log search page and find historical conversations.
You can filter logs by execution status and conversation keywords to query a conversation round within seven days and its debugging log details.
QR code debugging
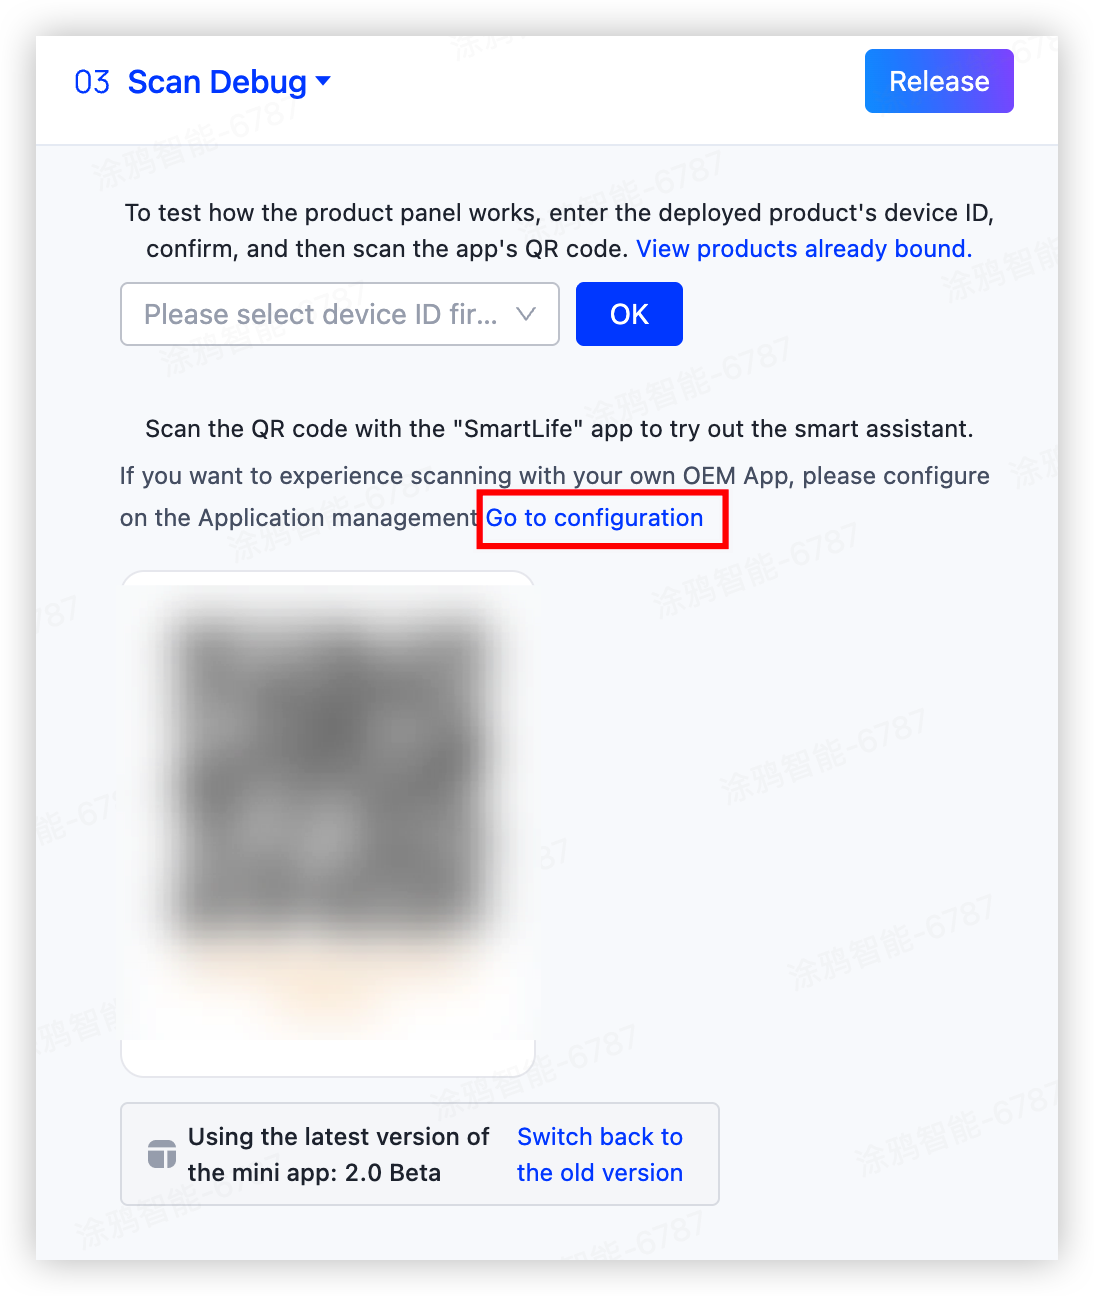
QR code debugging provides a preview of the MiniApp conversation experience. You can deploy the agent to a product PID or your own OEM app. After scanning the QR code with the SmartLife App or your OEM app, you can preview the actual MiniApp conversation experience.
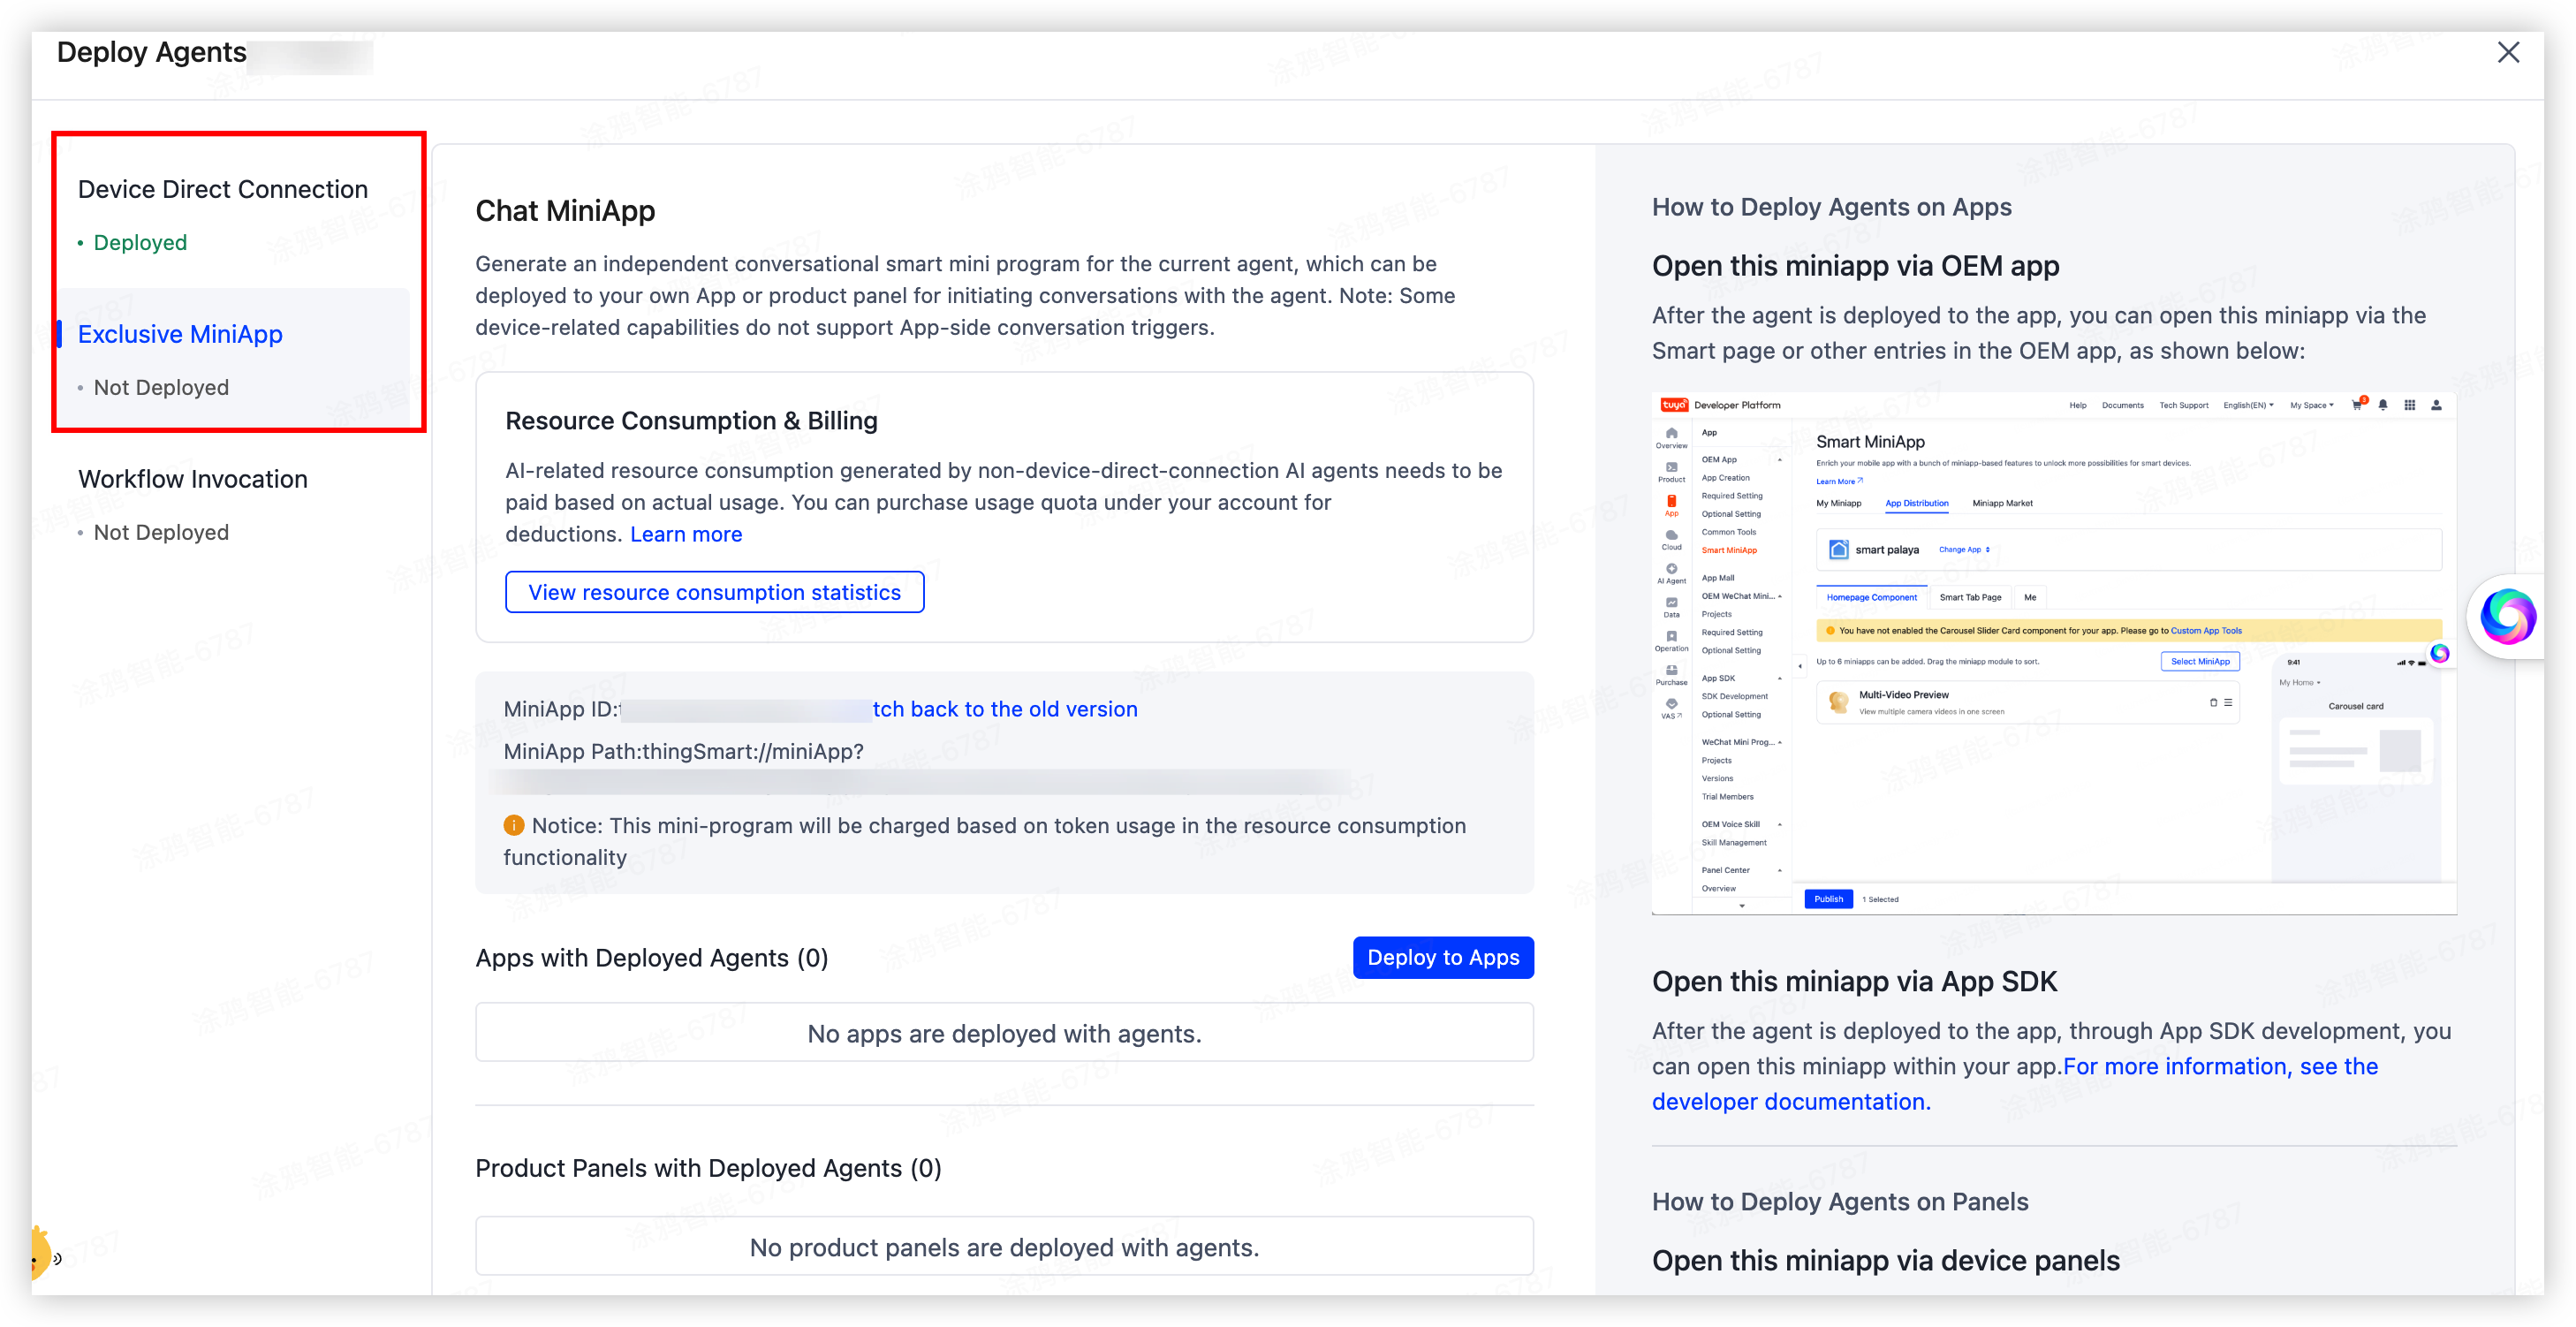
Click Retrieve QR code to generate one. The page then prompts you to deploy to an OEM app. Click Go to configuration to open the deployment management page, where you can deploy the agent to a product PID and MiniApp.
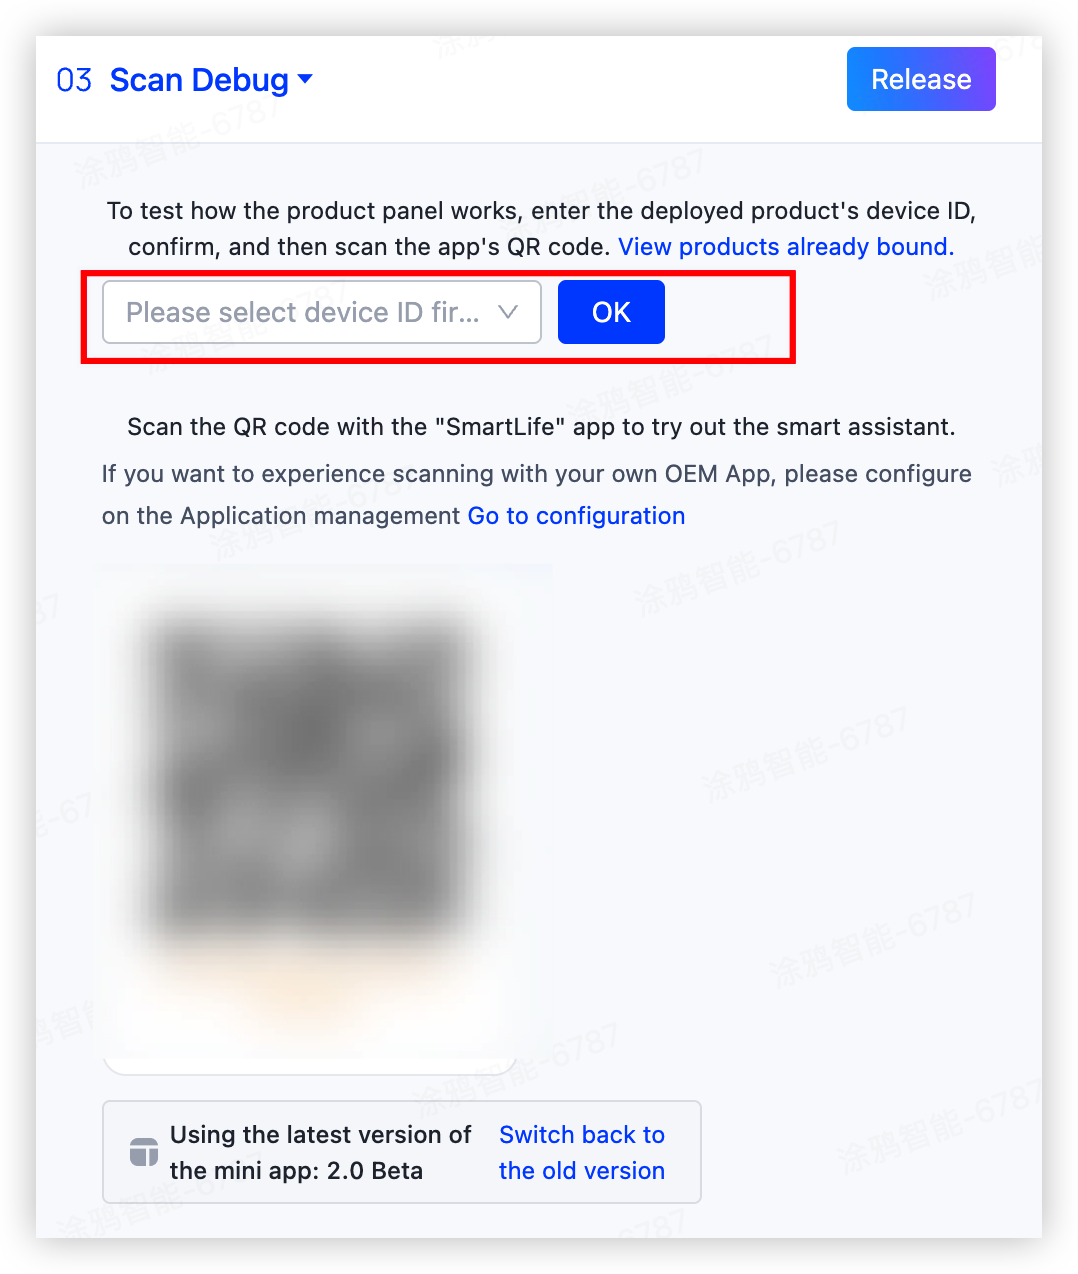
After deployment, you can configure a bound virtual device ID in the debugging window and scan the QR code to debug MiniApp conversations.
Is this page helpful?
YesFeedbackIs this page helpful?
YesFeedback