Agent Runtime Logs
Overview
During development, deployment, and commercialization of AI agent applications, developers need to trace and analyze the operational status and issues encountered during daily agent operation. In production, agent request chains are complex, decision-making is opaque, and performance bottlenecks are hard to identify, making troubleshooting difficult.
To address this, the Tuya AI Agent Development Platform provides a comprehensive observability solution for agents. The platform records the complete execution trace from a user’s conversation with a device to the device’s voice response. It also provides a structured display of the execution timeline and configuration details of each conversation round. This helps you review every AI decision, locate and analyze issues efficiently, and optimize performance.
Features
- End-to-End traceability: Designed for Tuya AI-powered smart hardware scenarios, the platform records run results and detailed information for every node throughout the entire interaction chain, from automatic speech recognition (ASR) → large language model (LLM) → text-to-speech (TTS). This feature helps you extend analysis scope and improve reliability and quality across the device-to-cloud workflow.
- Comprehensive information coverage: Logs cover node-level execution details for every stage of a conversation, including conversation start time, duration, runtime configuration, and more. You can fully understand the data foundation of each conversation round at runtime.
- Structured display: Each runtime node displays actual inputs, outputs, and timing in JSON format and as a tree topology. A burndown chart visualizes duration distribution across nodes, helping you quickly understand runtime behavior and turn black-box operations into transparent, white-box decision-making.
- Multi-source traceability: Supports logging and tracing for both debugging data and production runtime data. Also supports data logging for platform-orchestrated AI agents and workflows.
Terms
| Term | Definition |
|---|---|
Stage |
A stage is a task-type unit within a conversation round, covering the process from user input to robot output. It describes the complete processing pipeline of an agent request. For example, in a voice interaction scenario, stages include ASR → LLM processing → text-to-speech. |
| Stage type | The platform currently supports ASR, LLM, TTS, and INTERRUPT. |
| ASR stage | The process in which the ASR model converts a user’s audio stream into text after voice input is received. |
| LLM stage | The agent decision-making stage in which the LLM understands user intent, invokes skills, and generates structured responses or commands. |
| TTS stage | The process in which the TTS model synthesizes agent output into speech audio. |
| INTERRUPT stage | The process where the system listens to the audio stream and determines whether to interrupt the TTS during voice interaction between the user and the device. |
| Node | A node is the smallest operation unit run by an agent within a stage. Examples include invoking an LLM, running a tool function, reading from a knowledge base, or accessing a memory variable. Node-level visibility provides fine-grained performance analysis and logic tracing capabilities, enabling "white-box debugging". |
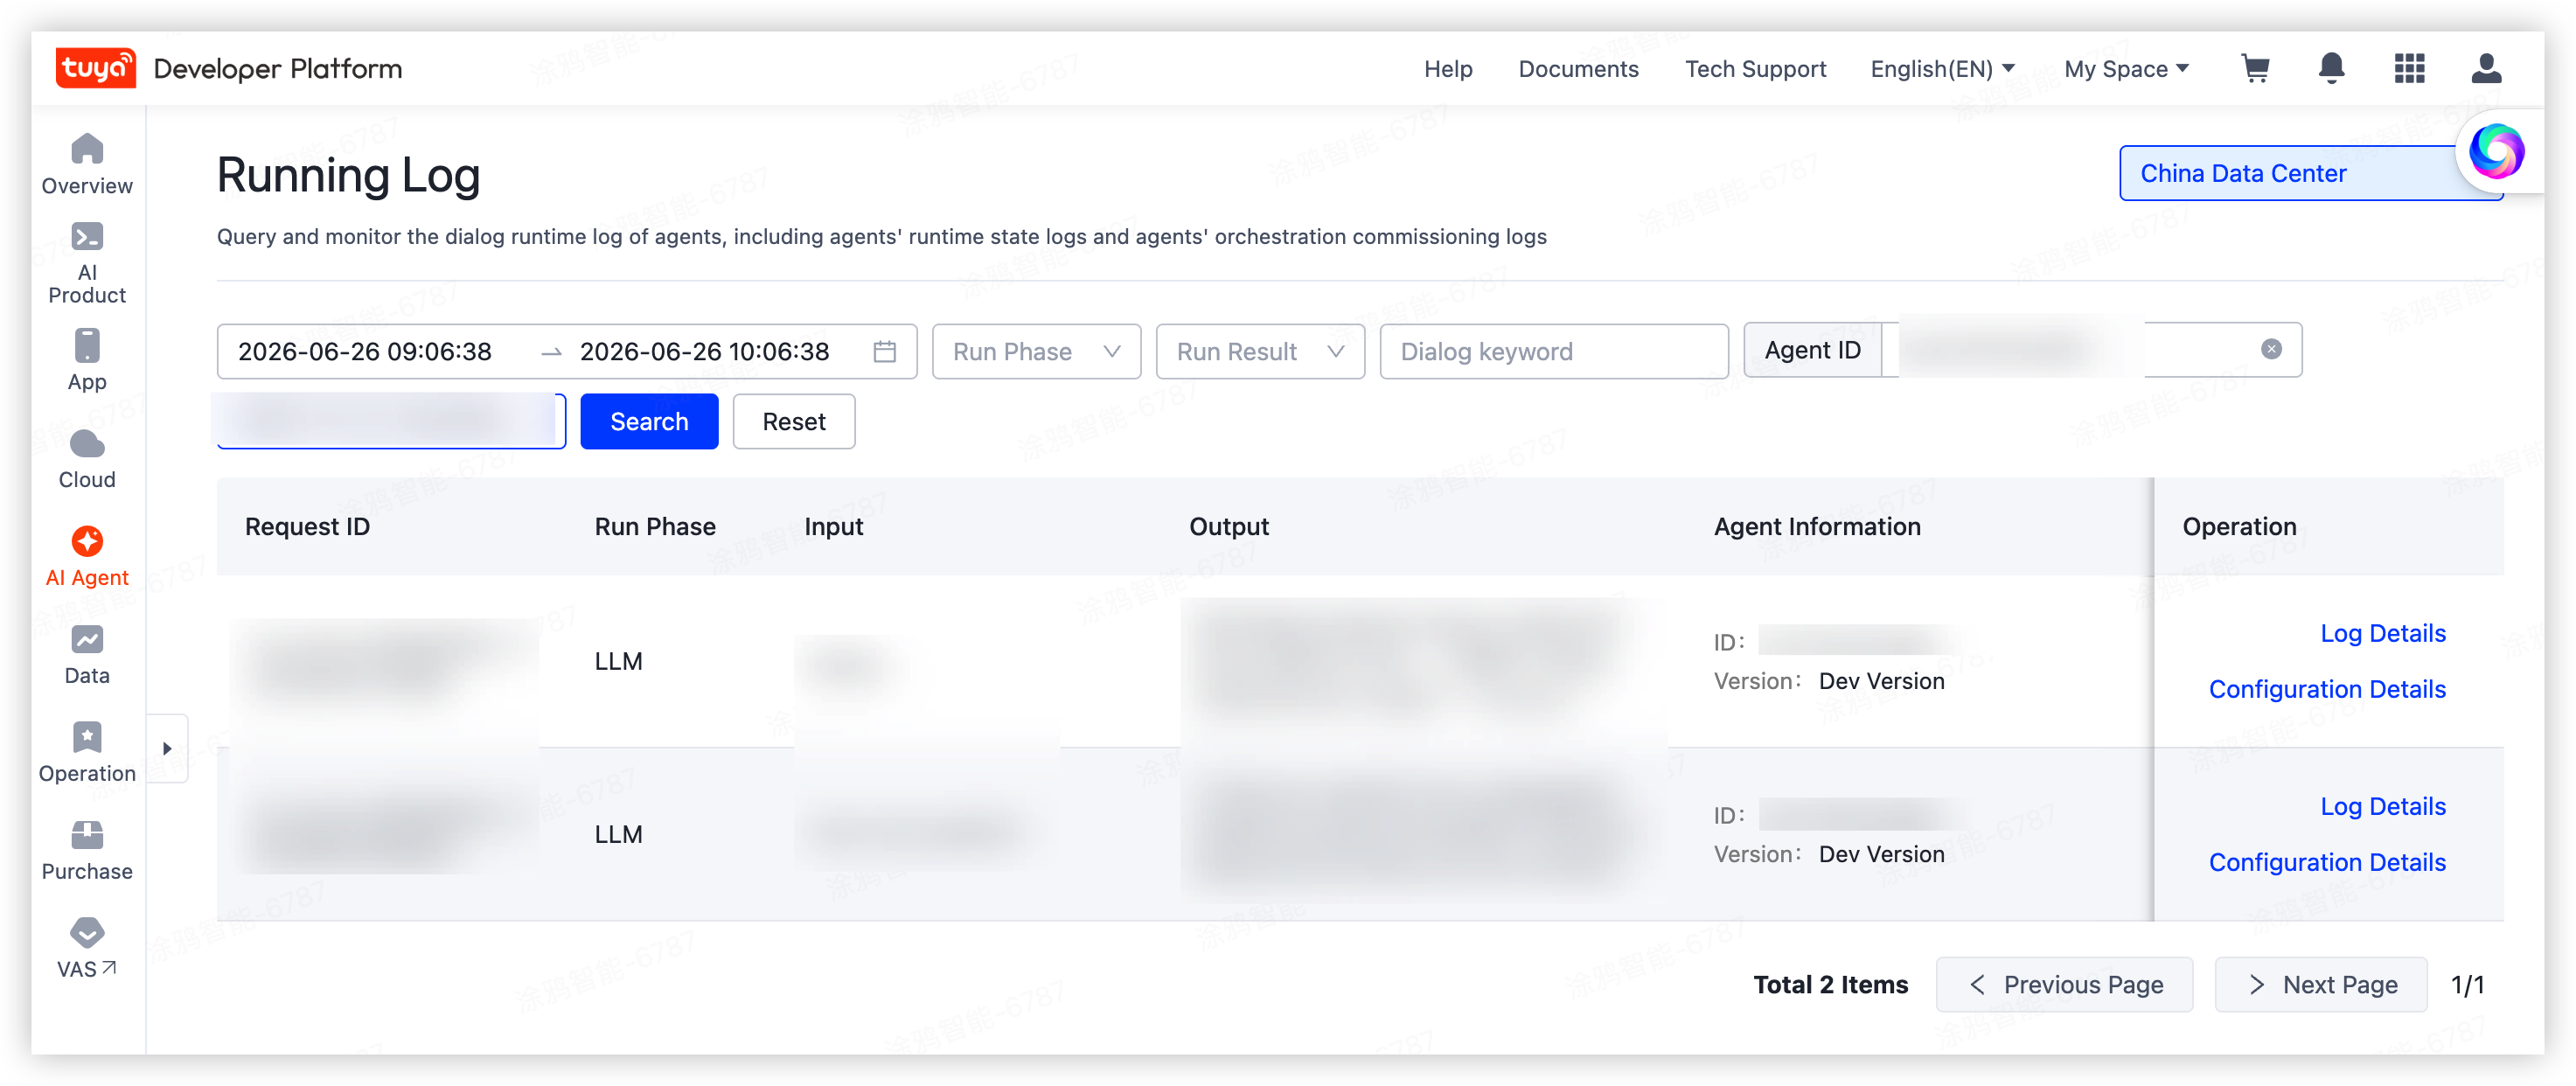
Query logs
Go to AI Agent > Statistics and Monitoring > Run Log to open the runtime log list.
Runtime logs support multiple data centers. Data is isolated between data centers. You can query logs for up to seven days.
Runtime logs can be searched using the following filters:
- Time range
- Device ID
- User account
- Dialog keyword
Each query supports a maximum time range of one hour.
Field descriptions
The following table describes key fields displayed in the runtime log list.
| Field | Description |
|---|---|
Dialog Keyword |
The keyword of the original user input in a conversation round. |
| Device ID | The device ID of the conversation. |
| User Account | The user account of the conversation. |
| Input | The user input in a conversation round. |
| Output | The agent output in a conversation round. |
| Agent ID | The instance ID of the agent for the conversation. In workflow mode, this is the ID of the agent bound to the workflow. |
| Agent Version | The published version of the agent. For logs generated during orchestration debugging, the version is displayed as the development version. In workflow mode, this is the version of the agent bound to the workflow. |
| Workflow ID | The instance ID of the workflow for the conversation. |
| Workflow Version | The published version of the workflow. For logs generated during orchestration debugging, the version is displayed as the development version. |
View log details
In the search result list, click Log Details in the Operation column to view detailed information for a conversation.
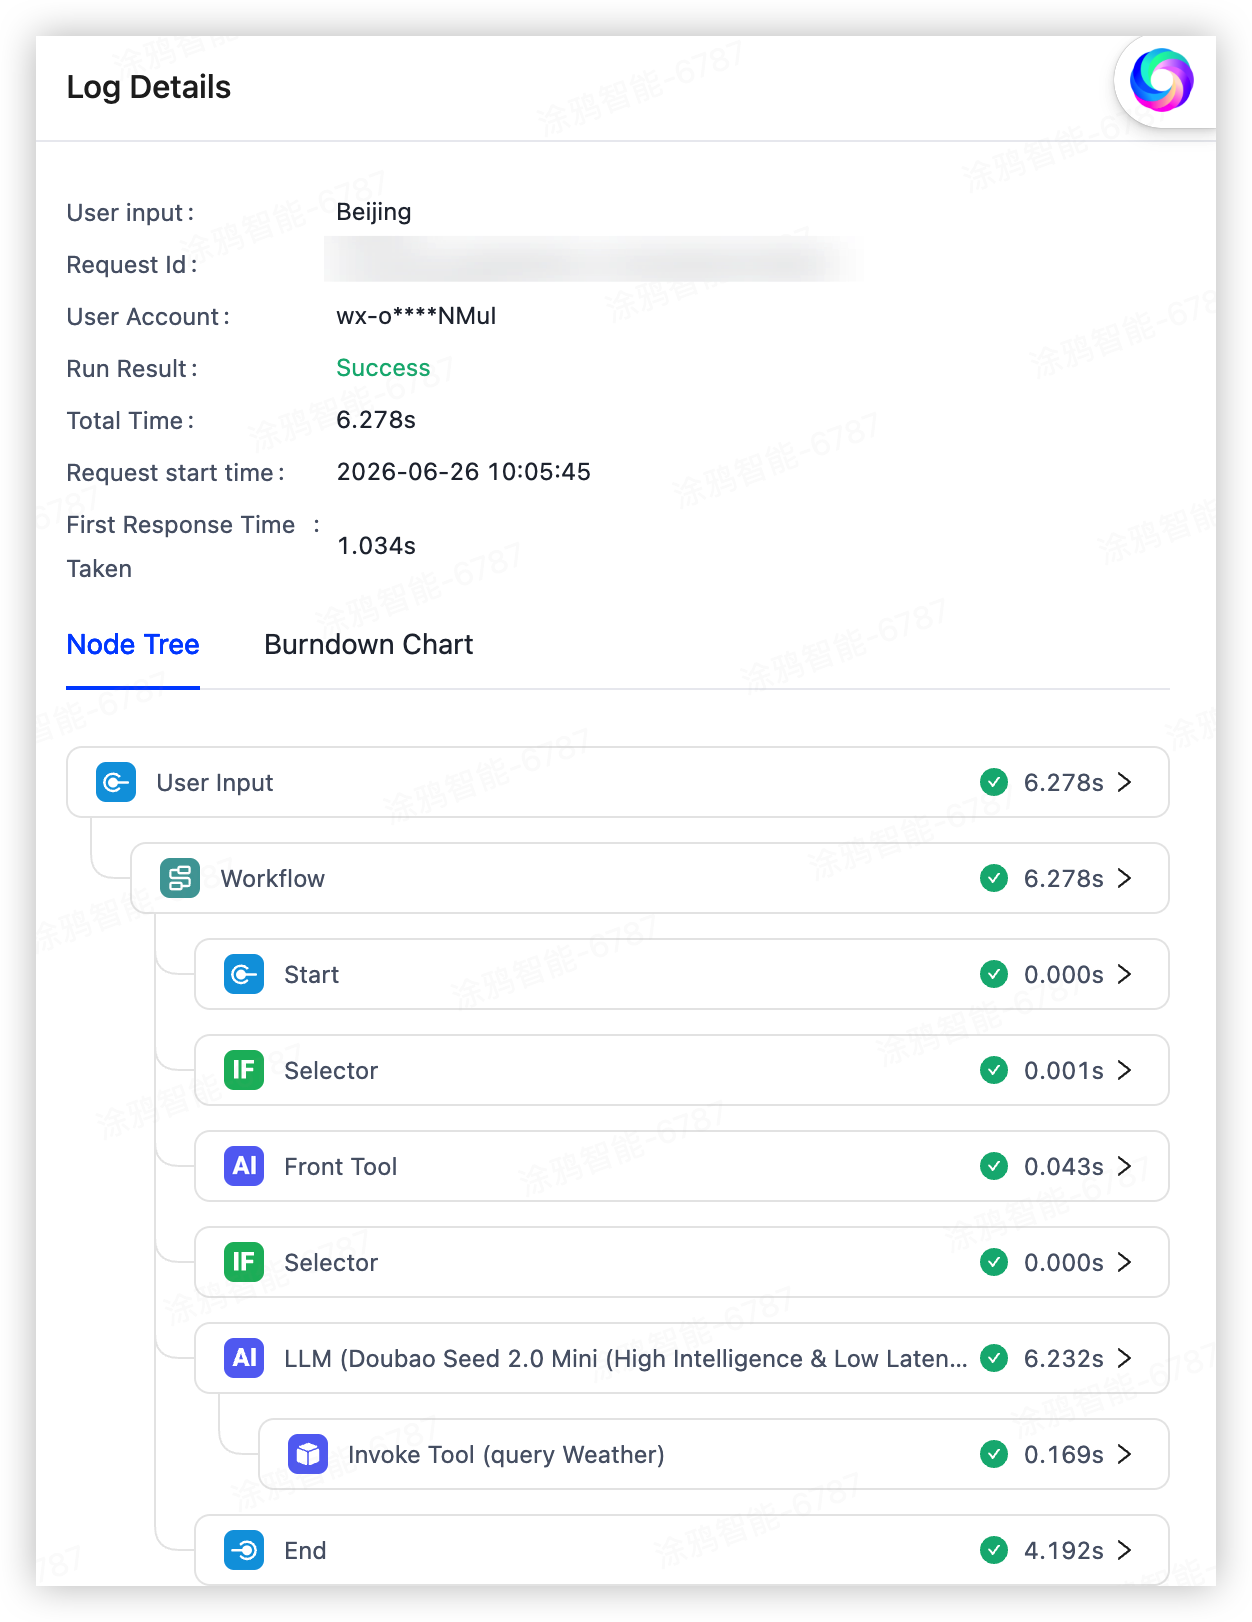
Log information
Basic information
Basic information for each conversation round includes the Request ID, start time, duration, device ID, and user account.
| Field | Description |
|---|---|
Request ID |
The request ID of the current conversation round. |
| Device ID | The device ID where the agent runs. |
| User Account | The user account of the current conversation round. |
| Run Result | The run result of the current conversation round. |
| Total Time | The total time consumed from input to output. |
| Request Start Time | The time when the current conversation round is initiated. |
| Time to first token (TTFT) | The elapsed time from request to first token. |
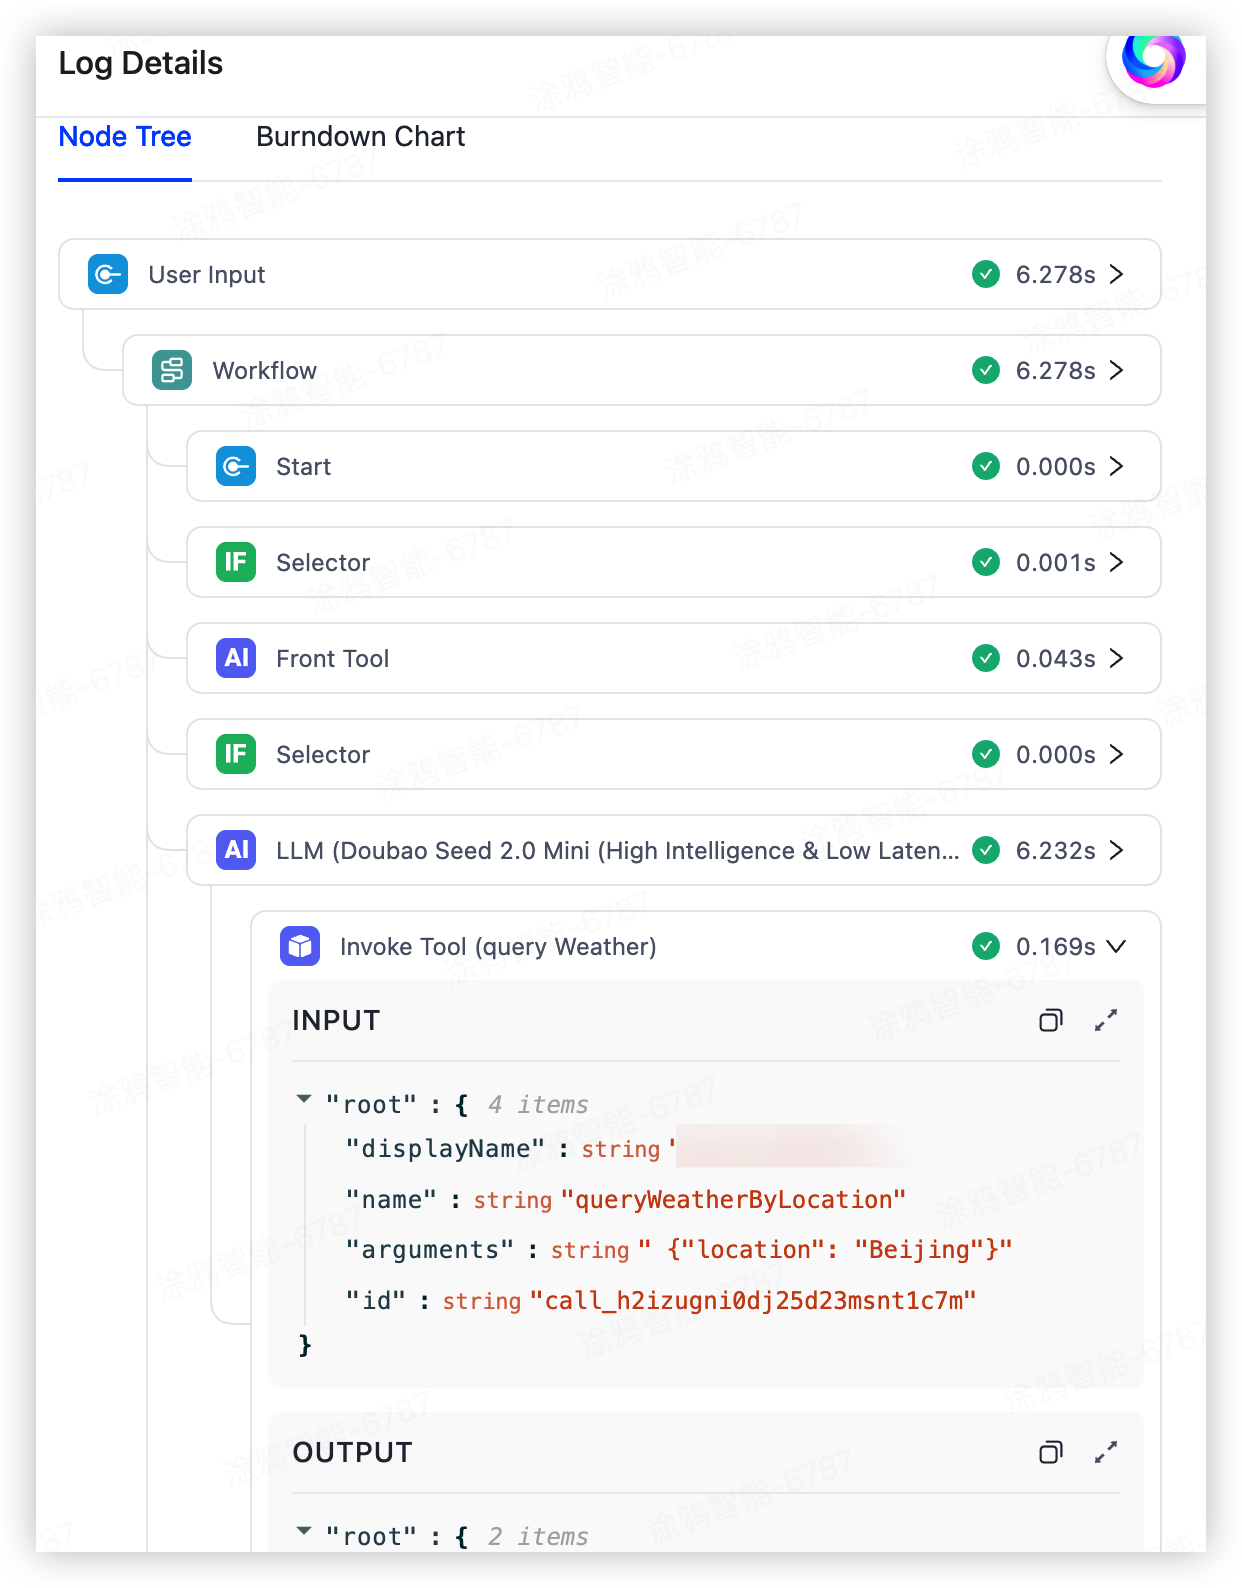
Node tree
The node tree visually displays the complete trace, including node topology, execution details, inputs, outputs, and run duration.
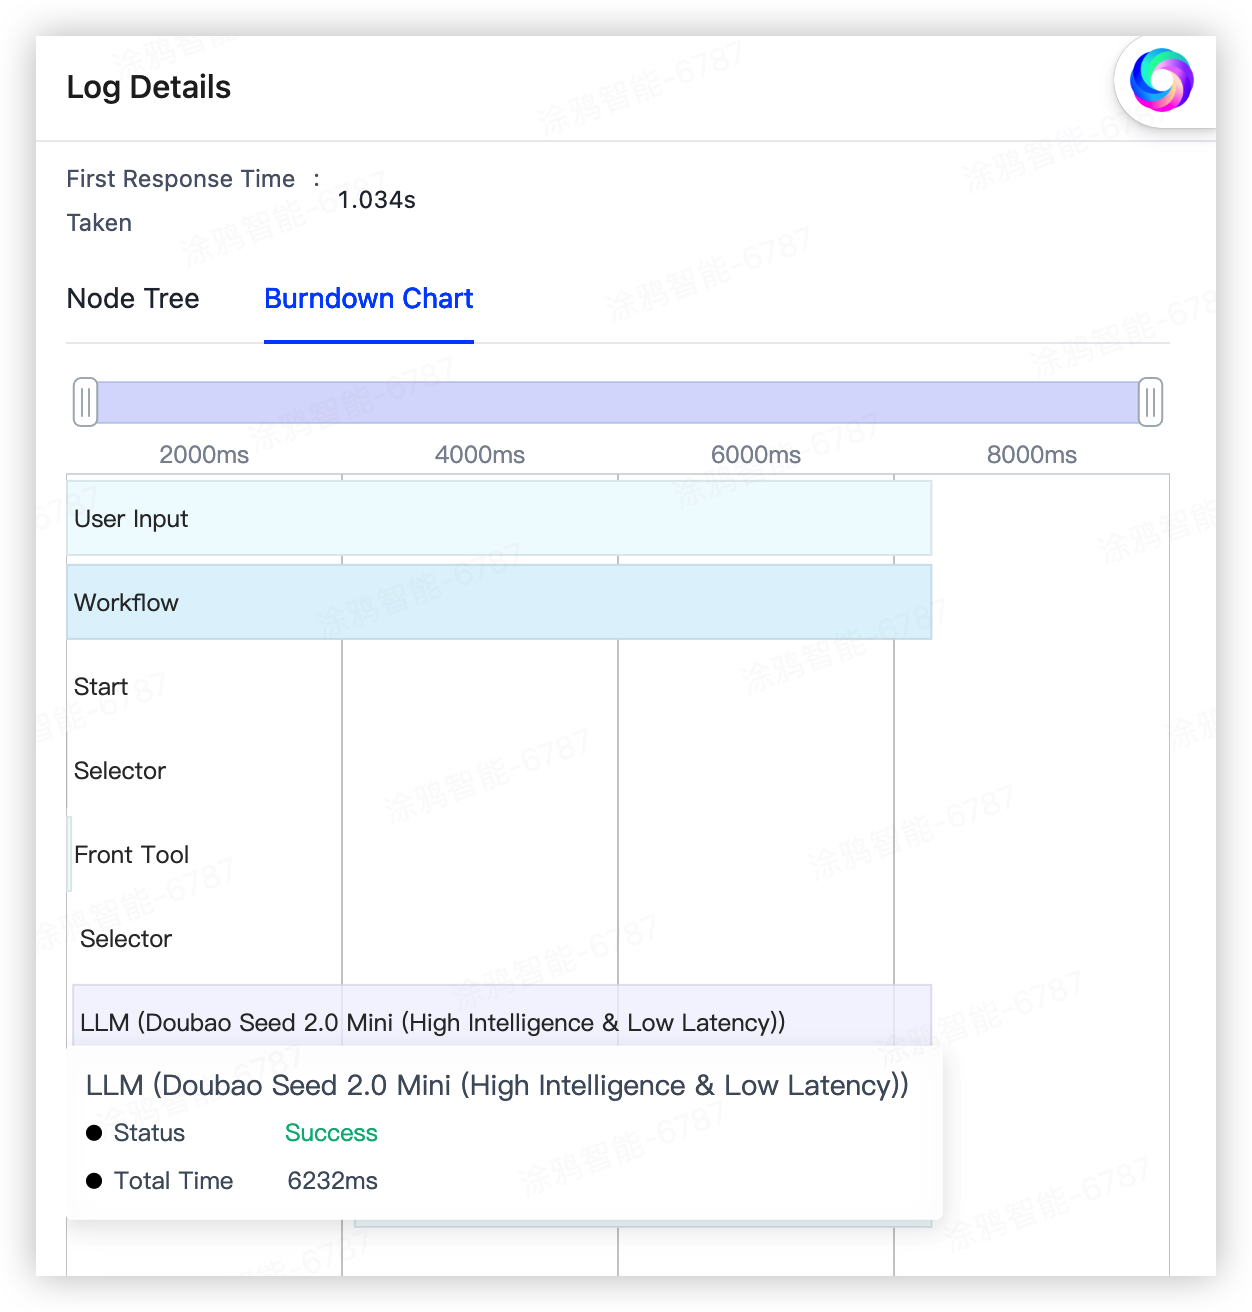
Burndown chart
The burndown chart displays how time is distributed across the trace and each node, helping you analyze and optimize response performance.
View configuration details
Configuration details display runtime role settings, voice interaction parameters, and contextual variables associated with a conversation, helping you reproduce and analyze real-world interactions.
In the search result list, click Configuration Details in the Operation column to view configuration information for a conversation.
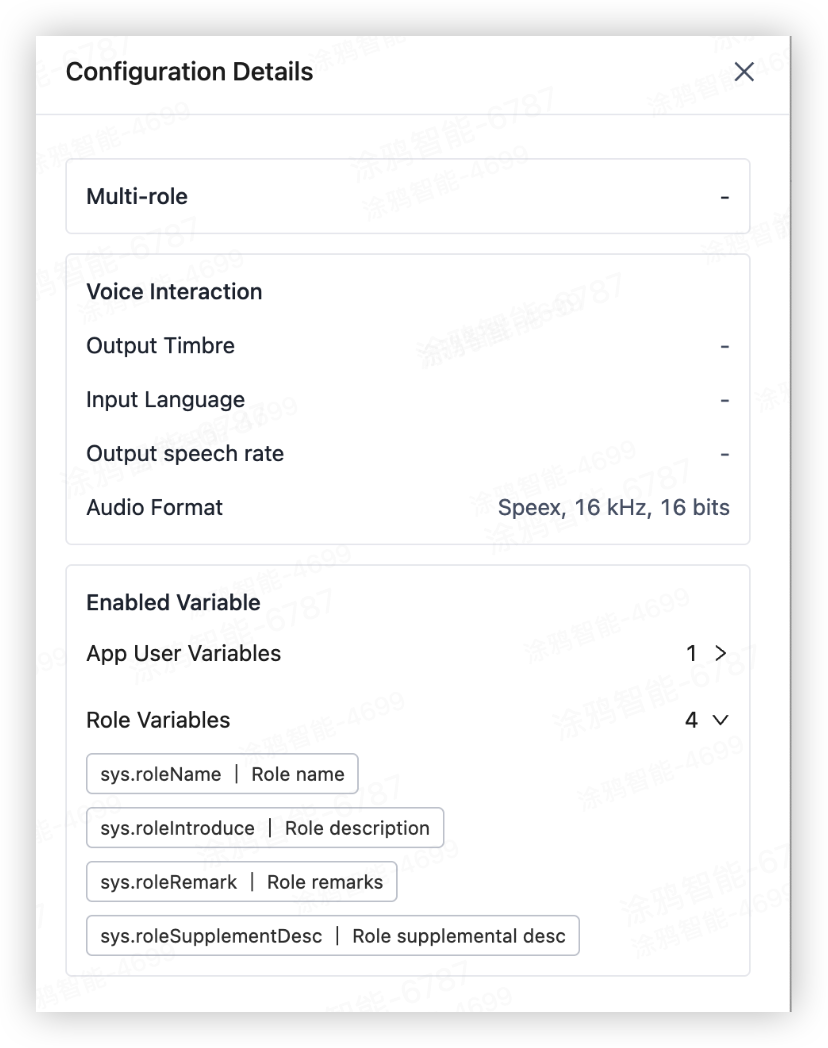
Configuration parameters
Configuration parameters includes runtime role settings, voice interaction parameters, and context variables for the conversation.
| Field | Description |
|---|---|
Multi-role |
The role configuration referenced during the conversation round. When multiple roles are enabled, voice interaction parameters are those configured for the referenced role. |
| Input Language | The language used for communication with the device. |
| Output Timbre | The timbre used for device speech playback. |
| Output Speech Rate | The speech rate used for device voice playback. |
| Audio Format | The audio format used for device voice output. |
| Enabled Variable | The variables and corresponding values referenced during the conversation round. |
Is this page helpful?
YesFeedbackIs this page helpful?
YesFeedback