Debug Devices
This topic describes how to view device information, send instructions, and simulate a virtual device to report the information, helping you easily debug the device.
Step 1: Log in to debug page
Note: Currently, you can only debug the devices that belong to the assets system and devices linked with the Tuya app account.
Debug devices that belong to the assets system
- Log in to the platform.
- Choose Cloud > Development > My Cloud Projects and select a project.
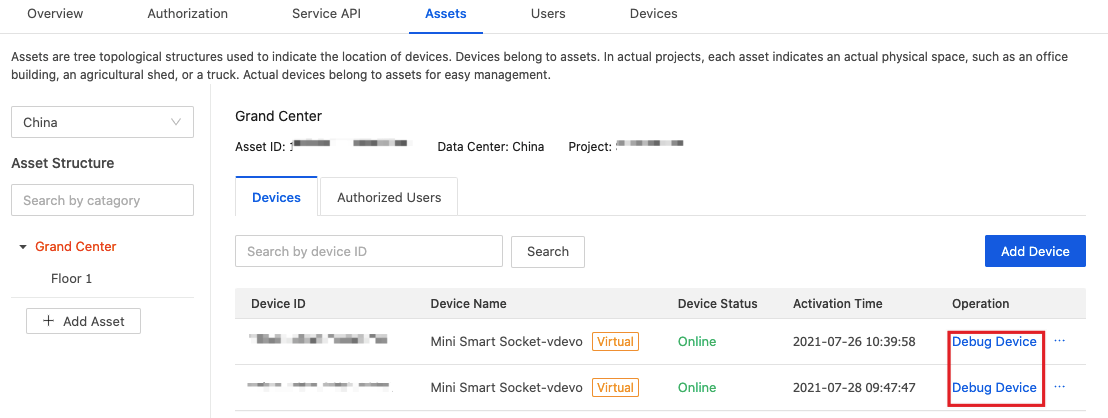
- Click Assets in the top navigation bar.
- Click the destination node of Asset Structure.
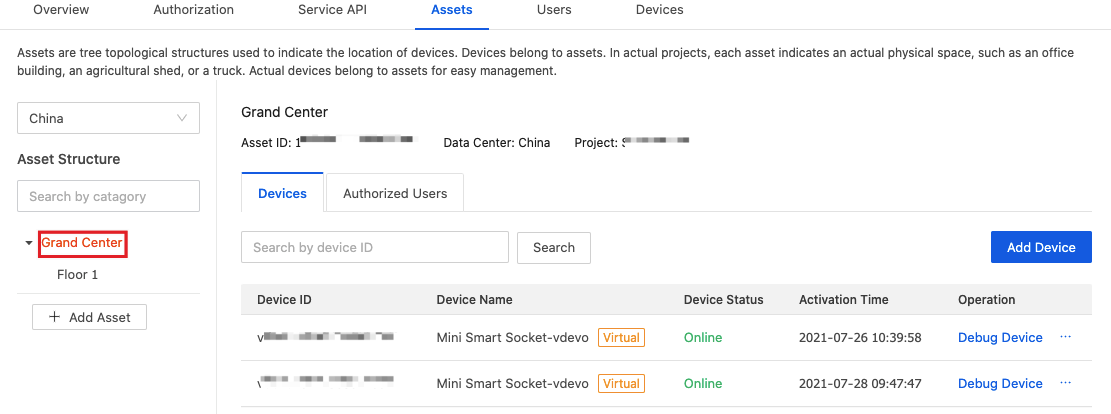
- Click the Devices tab, select a device, and then click Debug Device in the Operation column.
Debug devices linked with the Tuya app account
- Log in to the platform.
- Choose Cloud > Development > My Cloud Projects and select a project.
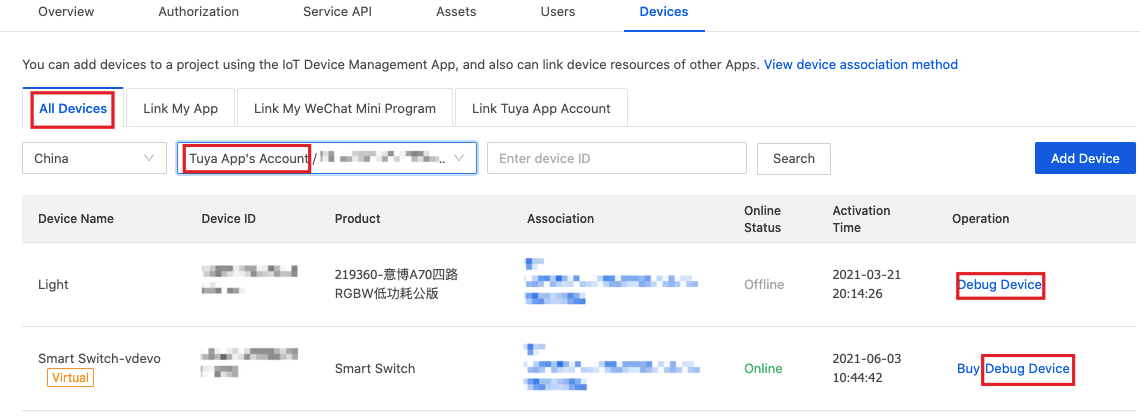
- Click the Devices tab.
- Click the All Devices tab.
- Select Tuya App’s Account from the drop-down list and click Debug Device in the Operation column.
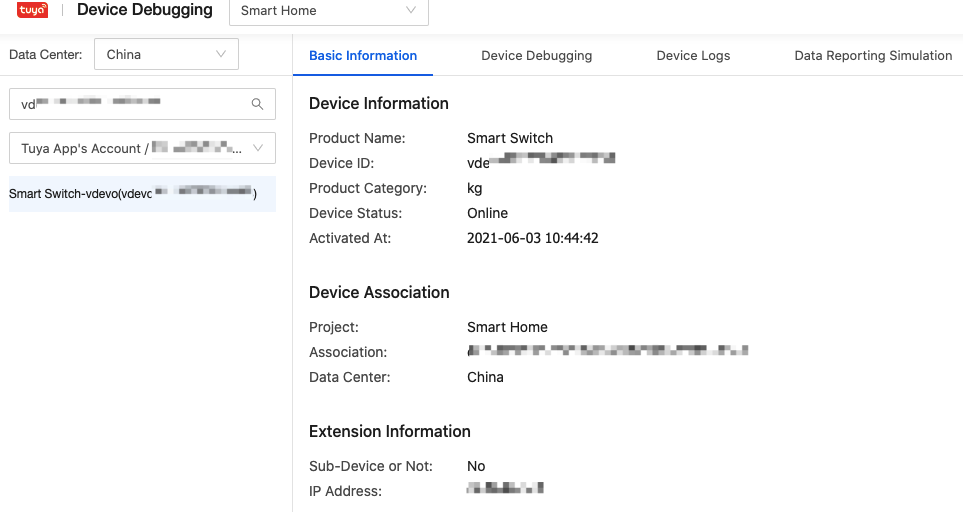
Note: You can view Device Information, Device Association, and Extension Information on the Basic Information page.
Step 2: Debug the device
View basic information
You can view Device Information, Device Association, and Extension Information on the Basic Information page.
Send instructions to the device
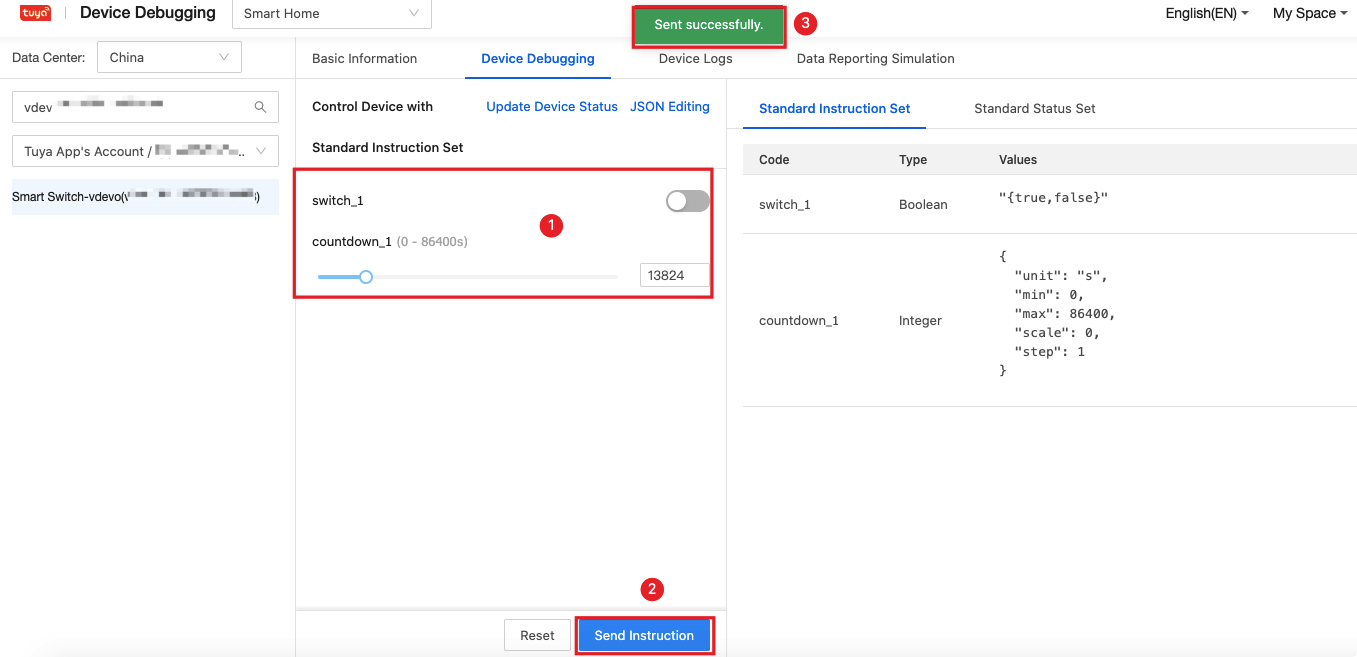
Click the Device Debugging tab. The controlled device is shown in the left pane, while Standard Instruction Set and Standard Status Set are shown in the right pane.
-
Modify the status of the data point on the default Visual Editing page.
Note: Click Update Device Status to get the latest status of the device.
-
Click Send Instruction.
Note: You can click JSON Editing to edit in the JSON format. To switch back to the Visual Editing page, click Visual Editing and click OK on the dialog box that appears.
-
After the instruction is sent, the page prompts Sent successfully.
Report device data to the cloud
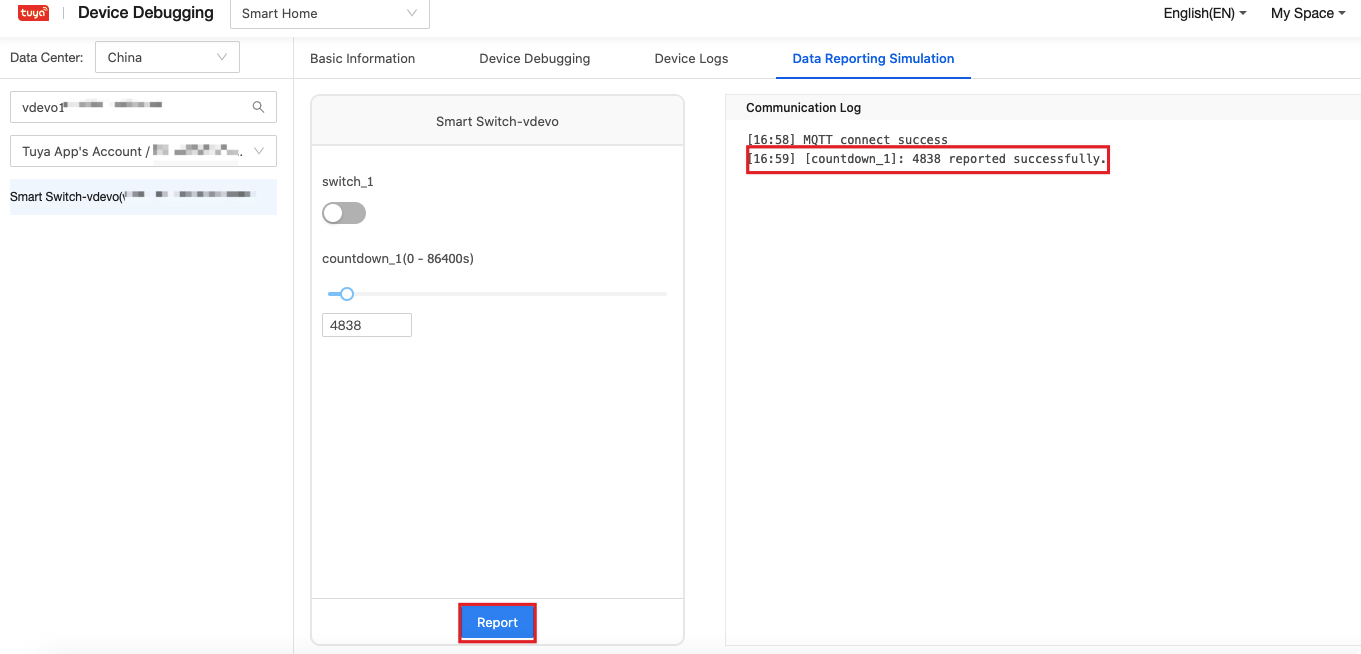
You can simulate device data reporting and perform related tests such as message subscription and reception.
Note: Currently, only virtual devices are supported, and real devices cannot be operated here. If there is no change in the device status, the data cannot be reported after you click Report.
-
Click the Data Reporting Simulation tab. The device operation panel is shown in the left pane, while Communication Log is shown in the right pane.
-
Wait for the Communication Log to show "MQTT connect success".
-
Modify the data point parameters or switches of the device, click the Report button below, and the communication log shows that the data is reported successfully.
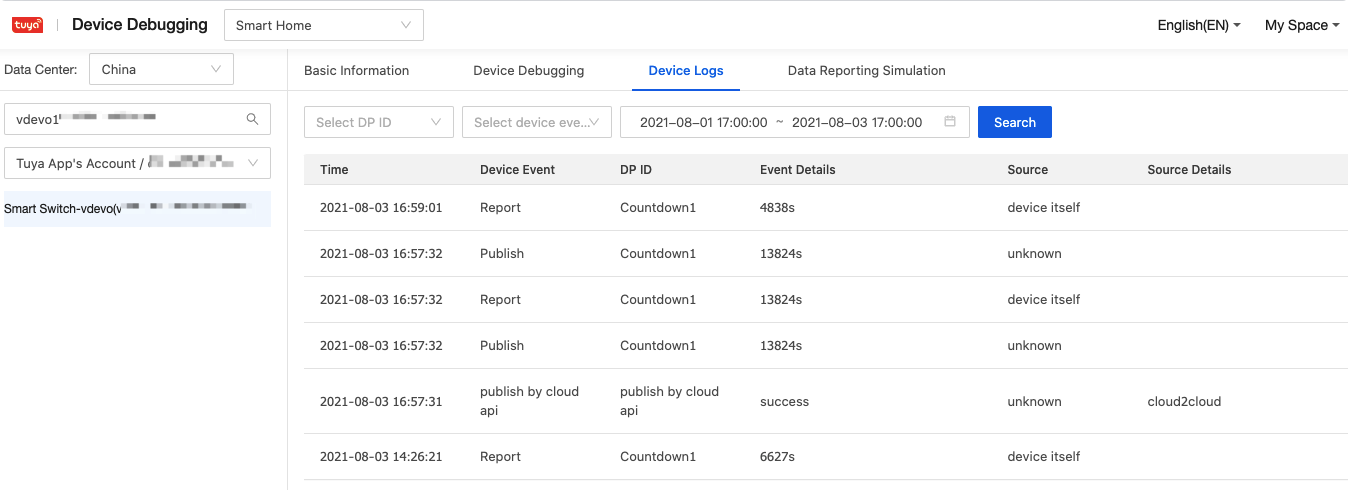
Step 3: View device logs
You can query the reporting log of the device. For a virtual device, you can query the simulated data reporting.
Is this page helpful?
YesFeedbackIs this page helpful?
YesFeedback