Step 3: Debug Device
You can simulate your real business scenarios with the device debugging feature. You can send commands to control a device to check if it can run properly.
Currently, you can only debug the devices that belong to the assets system and devices linked with the Tuya app account. This topic describes how to debug devices that belong to the assets system.
Prerequisites
You have added a device to the cloud project.
Procedure
Step 1: Log in to debug page
-
Log in to the Cloud Management on the Tuya Developer Platform.
-
In My Cloud Projects, click the target project.
-
Click the Assets tab.
-
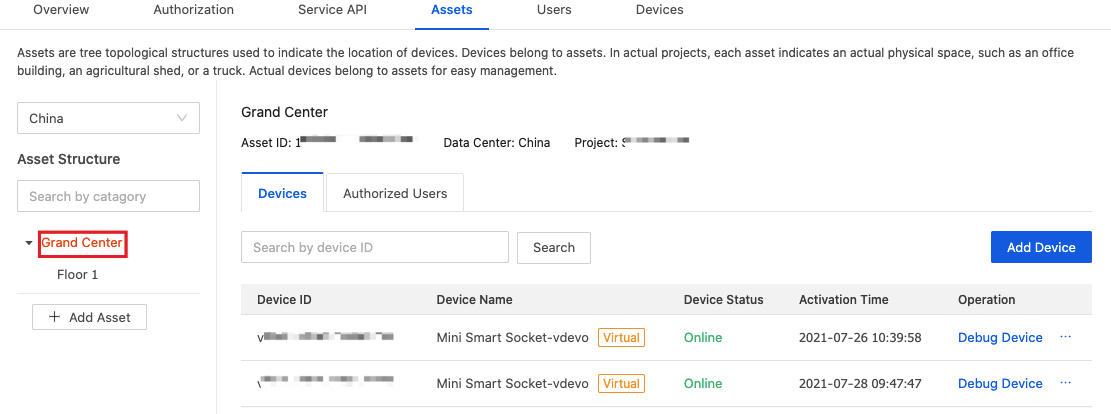
In the section of Asset Structure, click the asset to which your target device belongs.
-
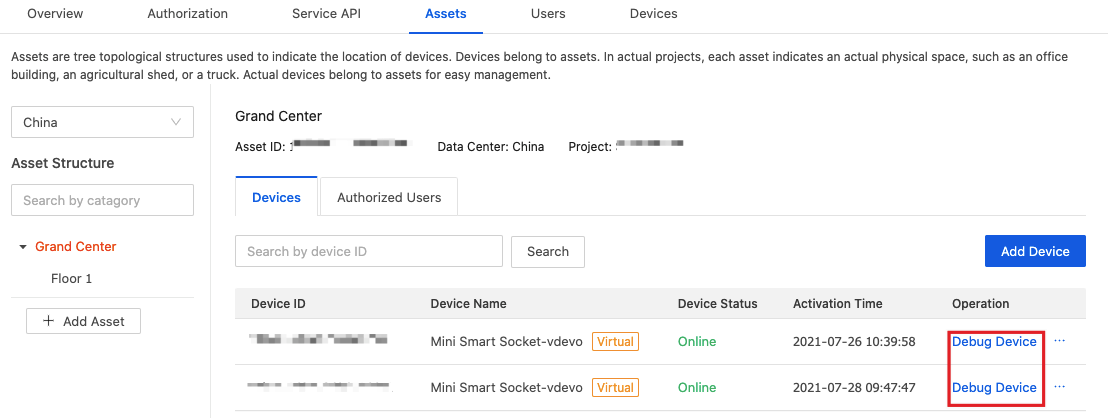
Click Devices on the right, find the device to be debugged, and then click Debug Device in the Operation column.
Step 2: Debug device
-
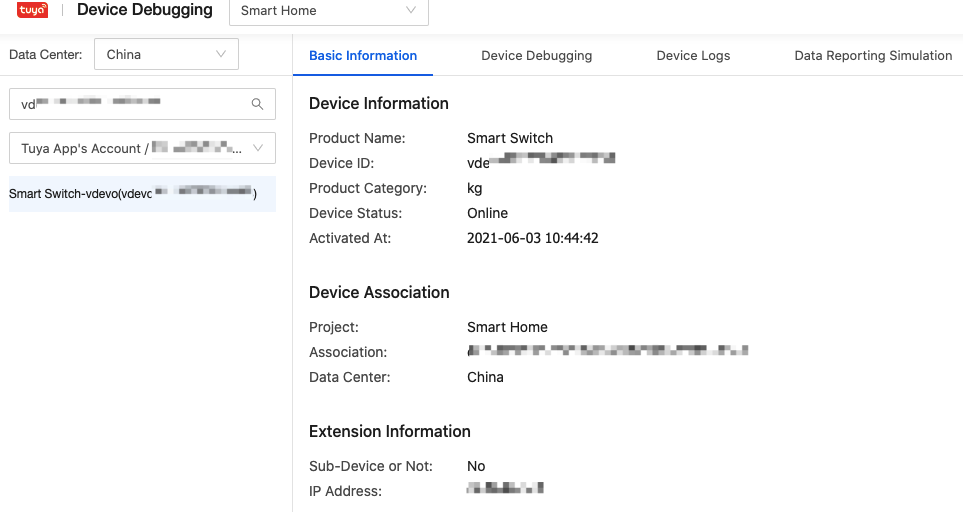
View the basic information.
On the Basic Information page, you can view information including the device ID, product category, associated project, and associated asset.
-
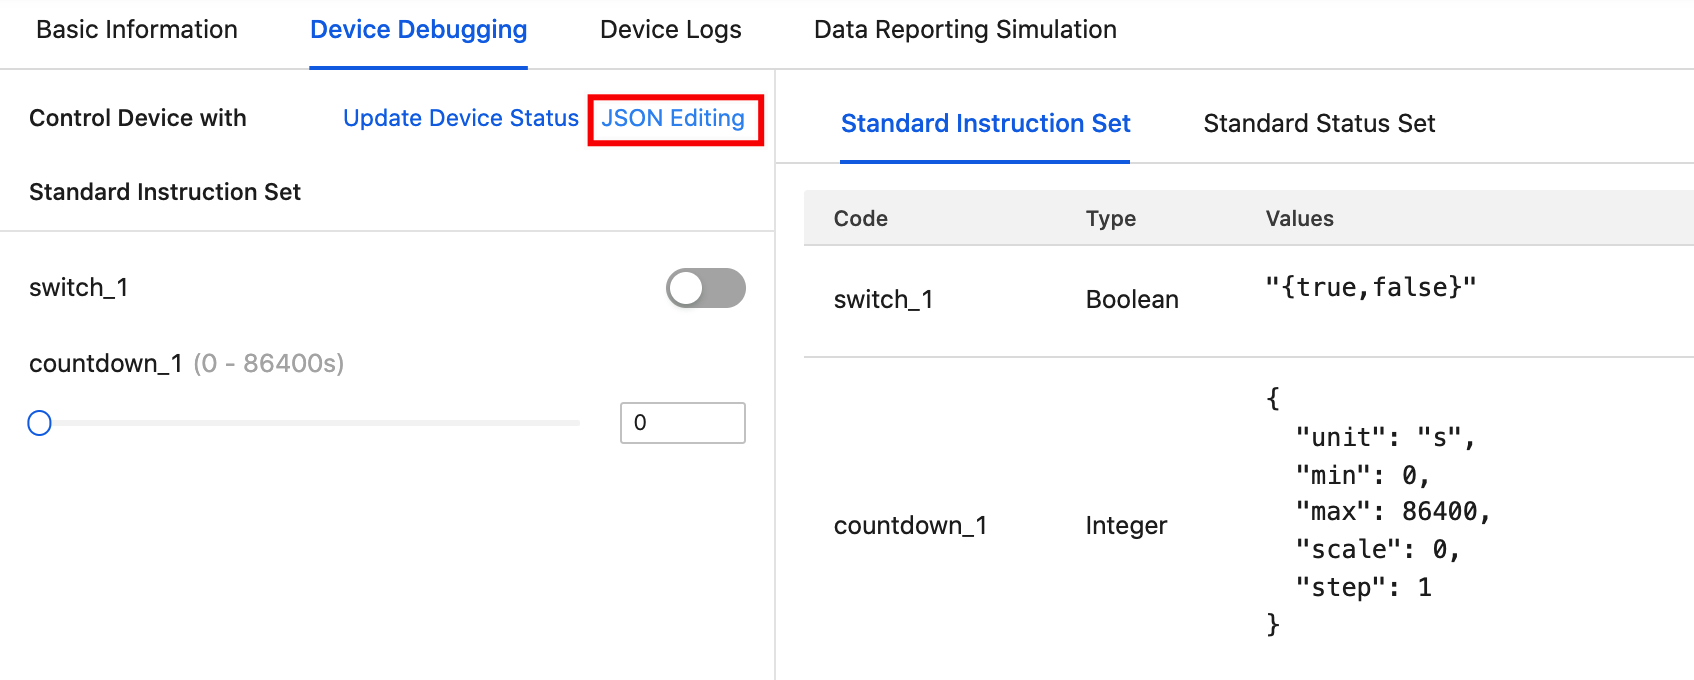
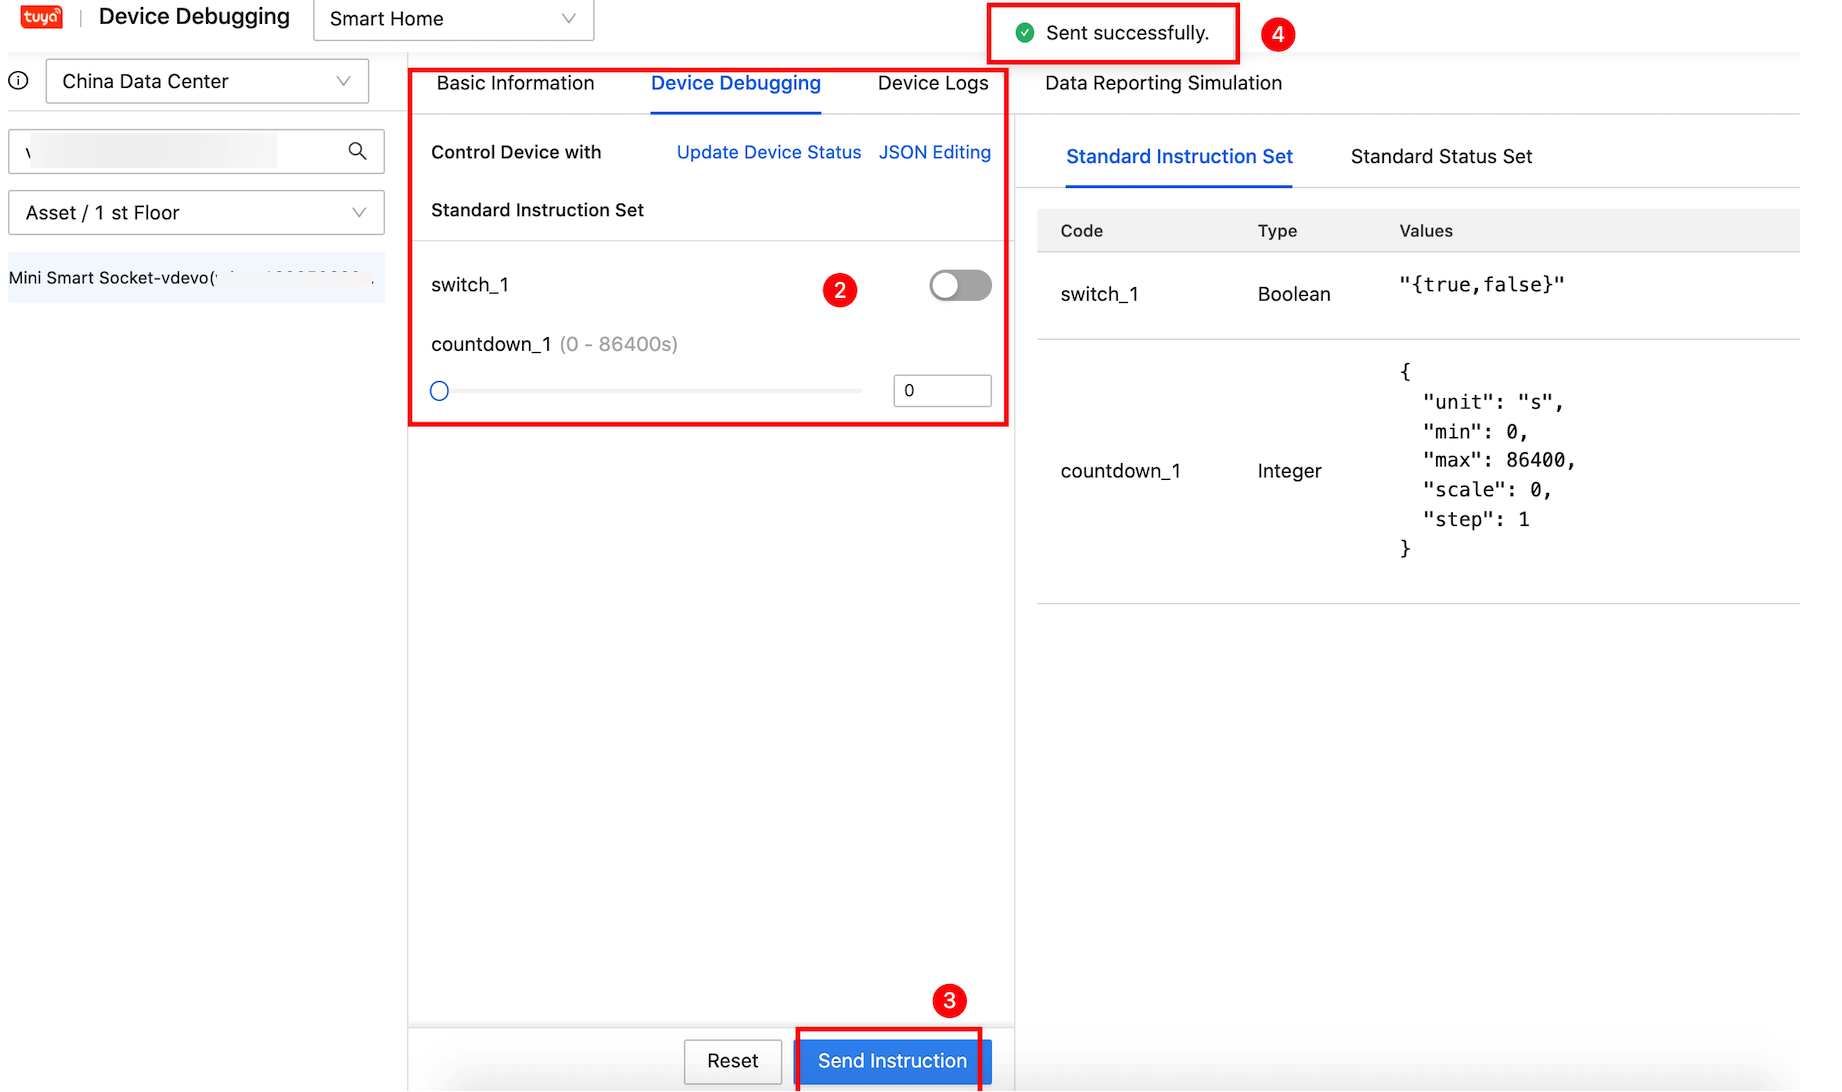
Send instructions to the device.
On the right side of the Device Debugging page, check how to enter the Standard Instruction Set and Standard Status Set.
Click Update Device Status to get the latest status of the device.
-
Under the tab of Device Debugging, click JSON Editing.
-
Edit the instruction with reference to the standard instruction set on the right.
-
After confirming the instruction, click Send Instruction.
-
After the instruction is sent, you can see Sent successfully on the page.
-
-
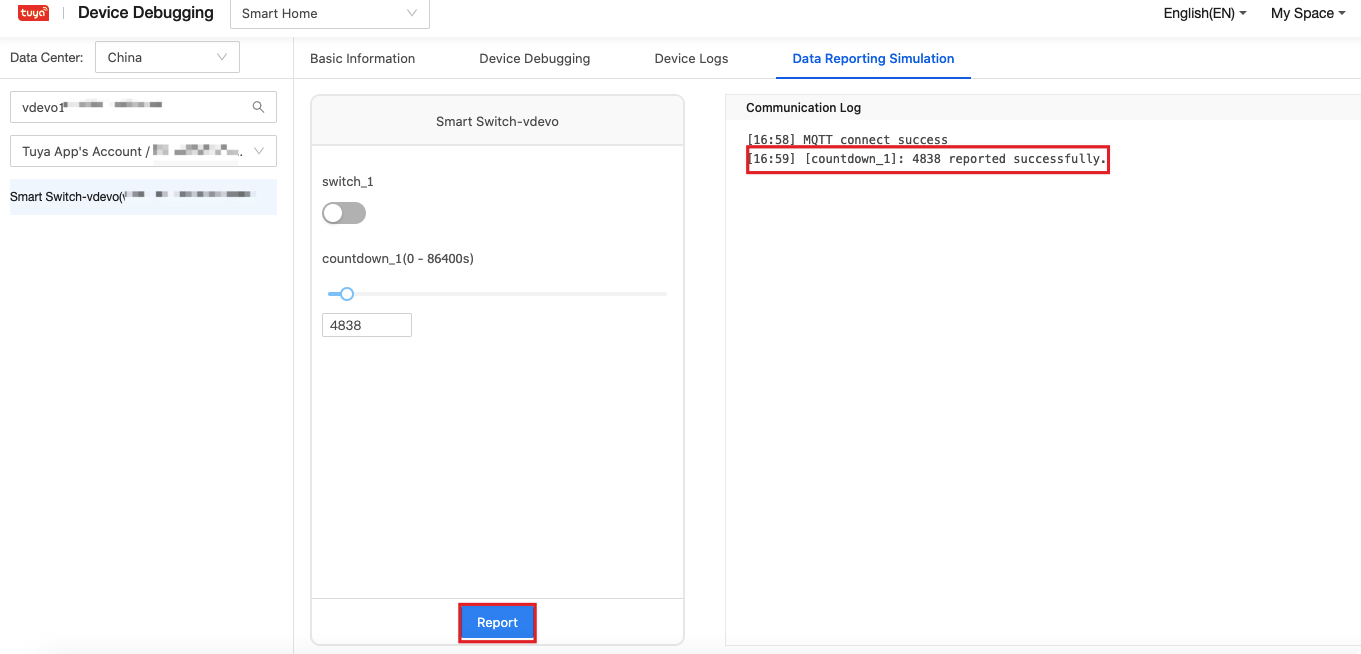
Report device data to the cloud.
You can simulate device data reporting and perform related tests such as message subscription and reception.Currently, only virtual devices can send data reporting instructions. If there is no change in the device status, the data cannot be reported.
-
Click Data Reporting Simulation on the top of the page, and wait for the Communication Log to show
MQTT connect success. -
Enable the target DP.
-
Click Report at the bottom. The communication log will show that the data is reported successfully.
-
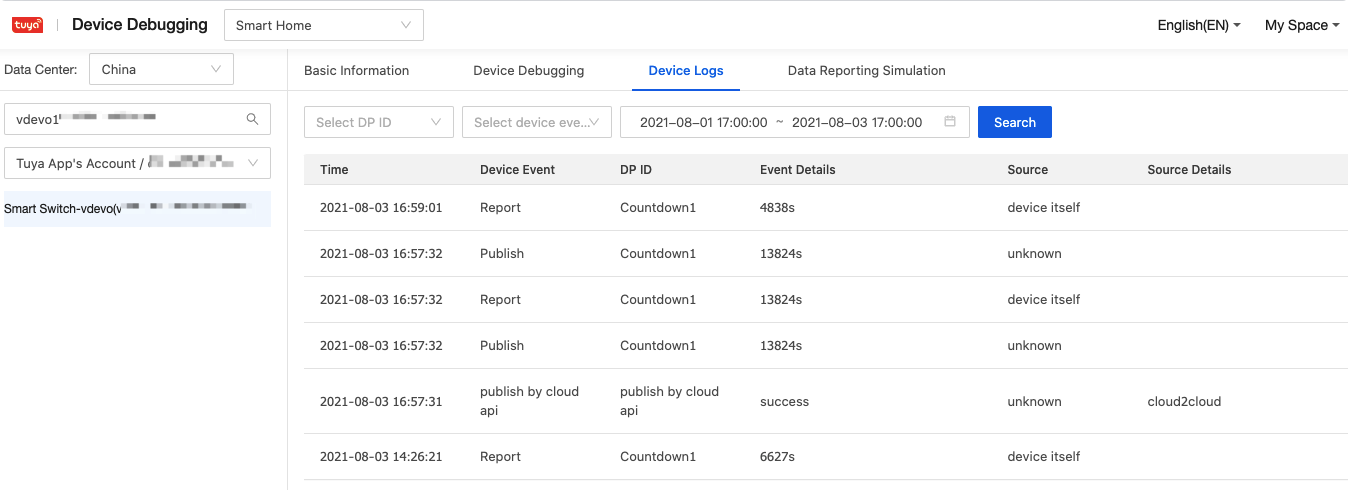
Step 3: View device logs
The system returns logs of all the data reporting and sending operations during device debugging. On the Device Logs page, you can query logs by DP ID, device event, and time.
Next steps
After the device is added and debugged, you can quickly develop IoT services on top of the IoT SDKs. For more information, see Step 4: Develop IoT Services.
Is this page helpful?
YesFeedbackIs this page helpful?
YesFeedback