Debug APIs with API Explorer
This topic describes how to subscribe to device control API products, and use API Explorer to check API calls and troubleshoot issues on the Cloud page of the Tuya Developer Platform.
Prerequisites
A sub-device is added to Tuya Edge Gateway (TEdge). For more information, see Manage Devices on Tuya Edge Gateway.
Procedure
-
Choose API Products > Industry Project and subscribe to Industrial General Device Control. For more information, see Manage API Products.
-
Choose Subscribed Products > Industrial General Device Control > Authorized Projects (Authorize) > New Authorization, and select your project in the dialog box that appears.
-
Choose Cloud > API Explorer and send control commands. For more information, see API Explorer.
-
Send control commands with API Explorer.
- Choose API Explorer > Control Device and set the
device_idfield. You can get the value ofdevice_idon the Sub-devices page of Tuya Edge Gateway. - Set the
commandsfield. The following code block shows the sample code:[ {"code":"switch_1","value":true}, {"code":"countdown_1","value":318} ]
- Choose API Explorer > Control Device and set the
-
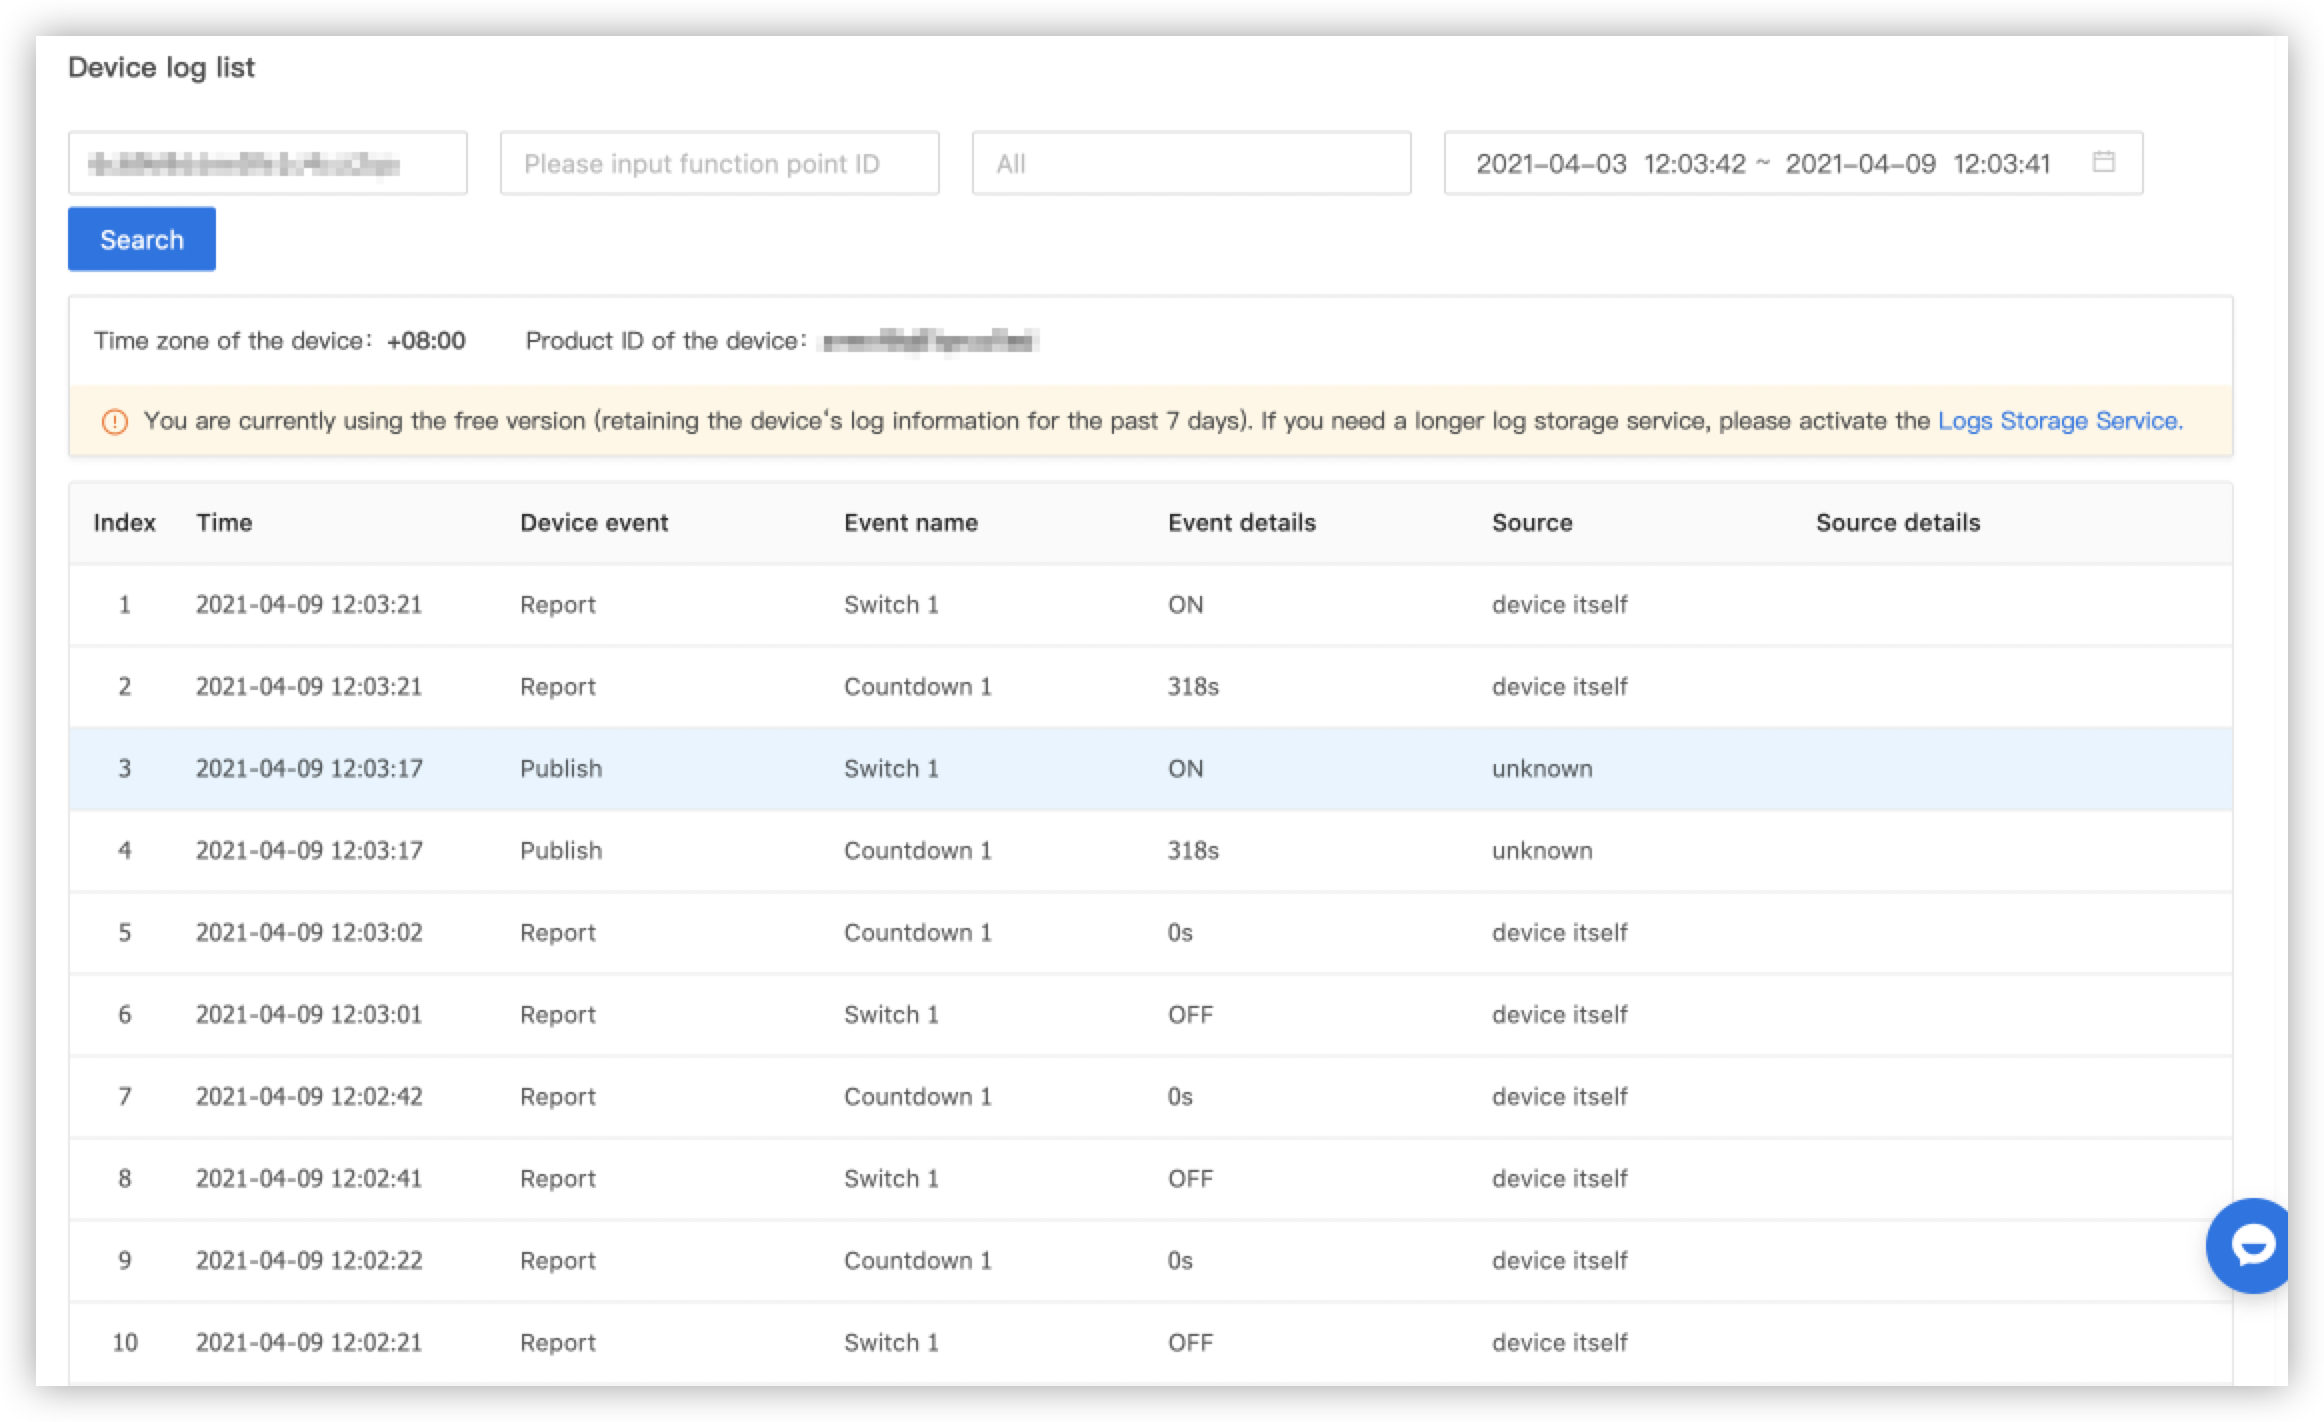
View device logs.
Go to the Log query page of the platform and enter the device ID to view device logs.
-
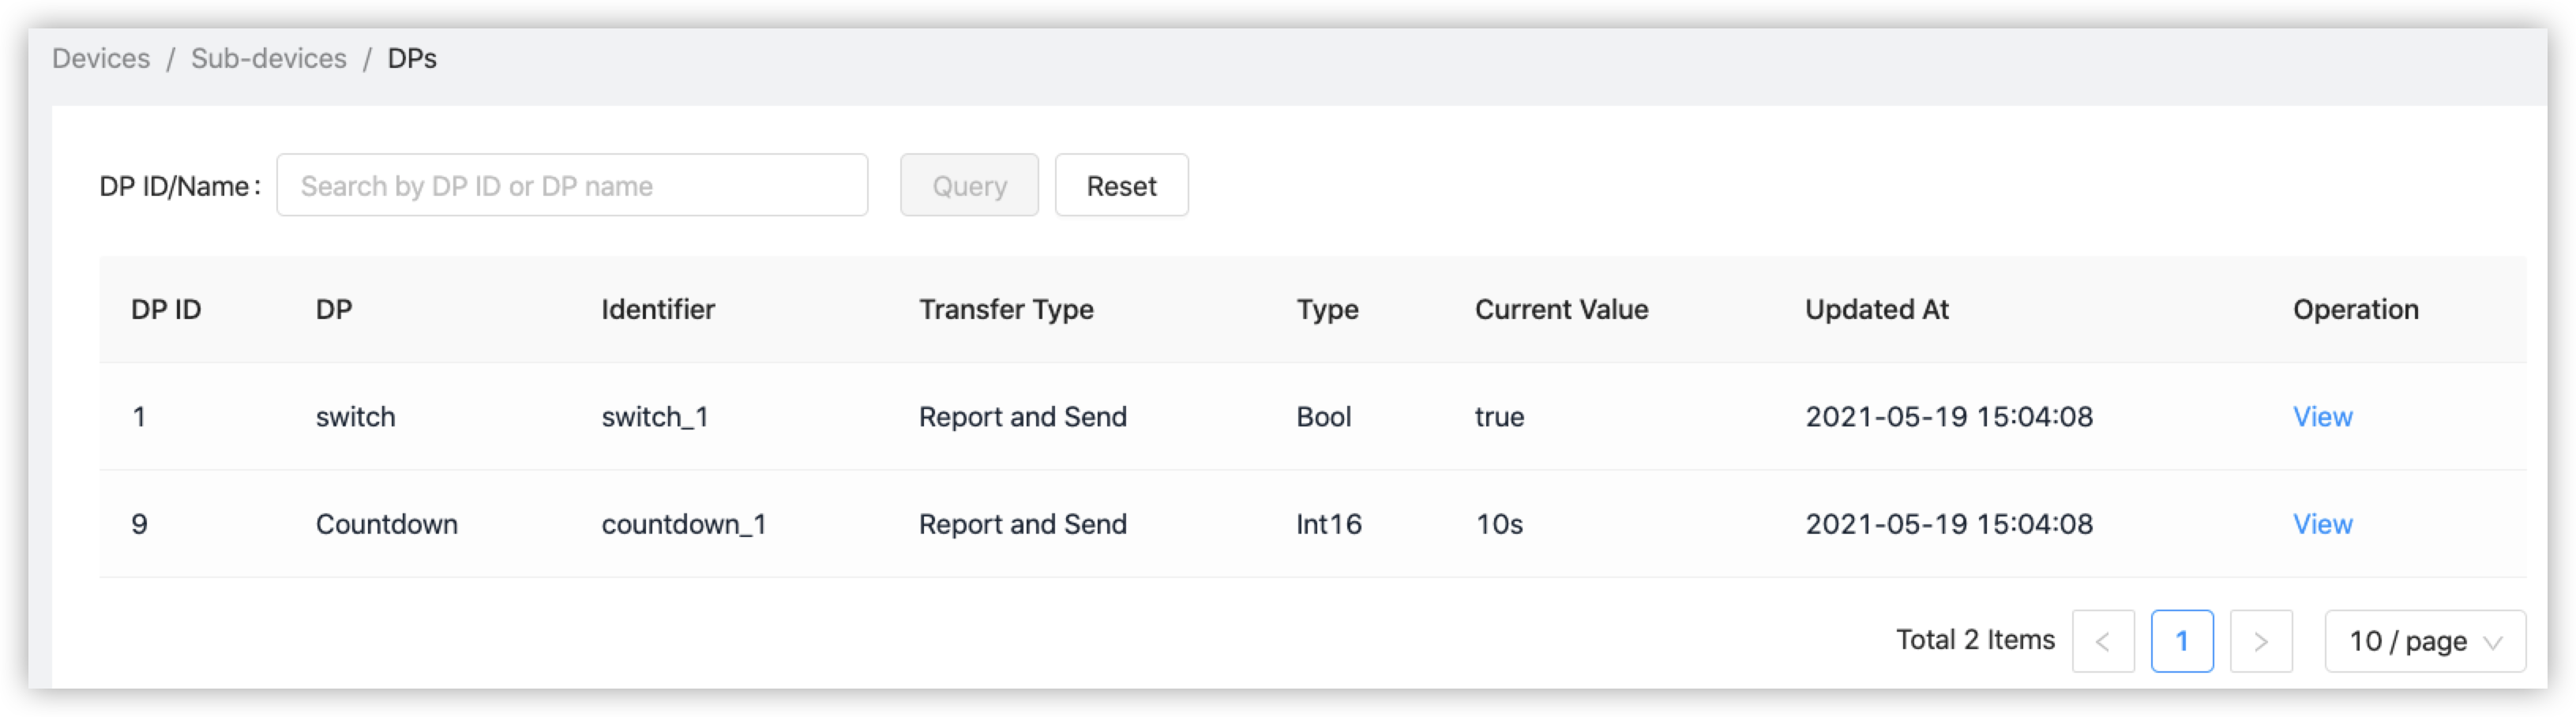
View sub-device status.
At the edge gateway, you can view the latest status of the sub-device for the edge gateway.
Is this page helpful?
YesFeedbackIs this page helpful?
YesFeedback